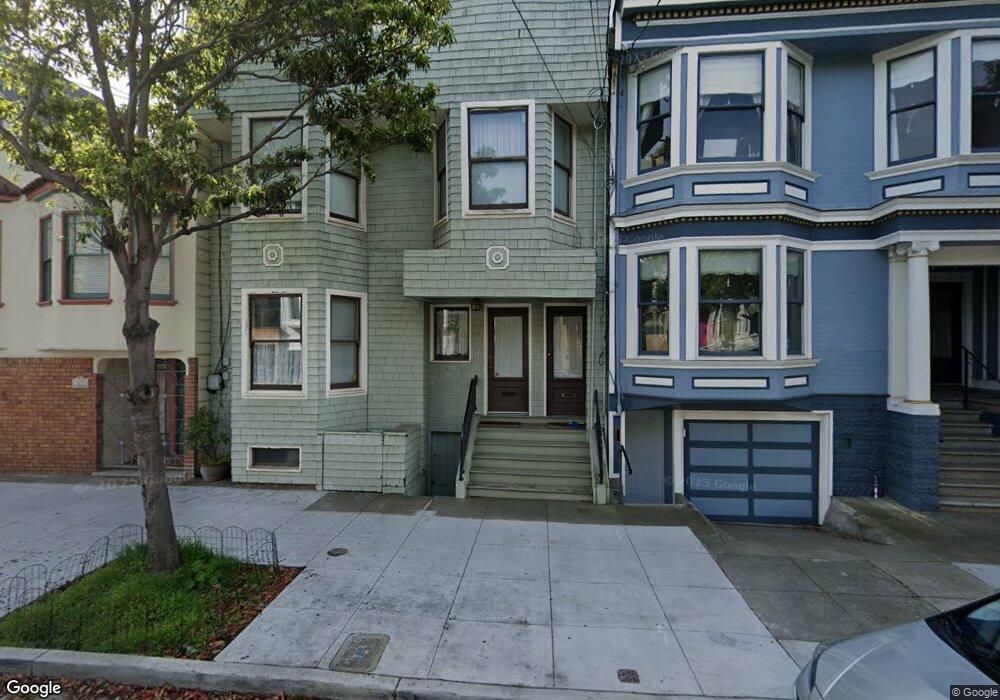
3825 Cesar Chavez St Unit 3829 San Francisco, CA 94131
Noe Valley NeighborhoodEstimated Value: $1,056,000 - $1,418,000
--
Bed
--
Bath
--
Sq Ft
2,831
Sq Ft Lot
About This Home
This home is located at 3825 Cesar Chavez St Unit 3829, San Francisco, CA 94131 and is currently estimated at $1,225,465. 3825 Cesar Chavez St Unit 3829 is a home located in San Francisco County with nearby schools including Alvarado Elementary, James Lick Middle School, and Katherine Michiels School.
Ownership History
Date
Name
Owned For
Owner Type
Purchase Details
Closed on
Jan 20, 2021
Sold by
Kravitz Scott and Scott Kravitz Separate
Bought by
Kravitz Scott and Scott Krp Vitz
Current Estimated Value
Home Financials for this Owner
Home Financials are based on the most recent Mortgage that was taken out on this home.
Original Mortgage
$365,000
Interest Rate
2.71%
Mortgage Type
New Conventional
Purchase Details
Closed on
Oct 18, 2017
Sold by
Saravanja Natasha and Kravitz Scott
Bought by
Kravitz Scott
Home Financials for this Owner
Home Financials are based on the most recent Mortgage that was taken out on this home.
Original Mortgage
$350,000
Interest Rate
3.83%
Mortgage Type
New Conventional
Purchase Details
Closed on
Apr 17, 2017
Sold by
Kravitz Scott
Bought by
Kravitz Scott
Purchase Details
Closed on
Oct 9, 2008
Sold by
Russell Mark C and Russell Katherina Urso
Bought by
Kravitz Scott A
Create a Home Valuation Report for This Property
The Home Valuation Report is an in-depth analysis detailing your home's value as well as a comparison with similar homes in the area
Home Values in the Area
Average Home Value in this Area
Purchase History
| Date | Buyer | Sale Price | Title Company |
|---|---|---|---|
| Kravitz Scott | -- | North American Title Co Inc | |
| Kravitz Scott | -- | Nex Title | |
| Kravitz Scott | -- | None Available | |
| Kravitz Scott | -- | None Available | |
| Kravitz Scott A | -- | Accommodation |
Source: Public Records
Mortgage History
| Date | Status | Borrower | Loan Amount |
|---|---|---|---|
| Closed | Kravitz Scott | $365,000 | |
| Closed | Kravitz Scott | $350,000 |
Source: Public Records
Tax History Compared to Growth
Tax History
| Year | Tax Paid | Tax Assessment Tax Assessment Total Assessment is a certain percentage of the fair market value that is determined by local assessors to be the total taxable value of land and additions on the property. | Land | Improvement |
|---|---|---|---|---|
| 2025 | $4,266 | $294,984 | $154,710 | $140,274 |
| 2024 | $4,266 | $289,202 | $151,677 | $137,525 |
| 2023 | $4,023 | $283,533 | $148,703 | $134,830 |
| 2022 | $3,929 | $277,975 | $145,788 | $132,187 |
| 2021 | $3,854 | $272,527 | $142,930 | $129,597 |
| 2020 | $3,889 | $269,735 | $141,465 | $128,270 |
| 2019 | $3,759 | $264,449 | $138,692 | $125,757 |
| 2018 | $3,632 | $259,266 | $135,973 | $123,293 |
| 2017 | $3,290 | $254,184 | $133,307 | $120,877 |
| 2016 | $3,208 | $249,202 | $130,694 | $118,508 |
| 2015 | $3,165 | $245,460 | $128,731 | $116,729 |
| 2014 | $3,082 | $240,654 | $126,210 | $114,444 |
Source: Public Records
Map
Nearby Homes
- 1325 Church St
- 3779-3781 25th St
- 3936 26th St
- 245 Duncan St
- 1294 Guerrero St
- 101 28th St
- 350 San Jose Ave Unit 7
- 350 San Jose Ave Unit 12
- 350 San Jose Ave Unit 5
- 340 San Jose Ave
- 4040 Cesar Chavez
- 248 Valley St
- 1161 Church St
- 55 Valley St
- 55 Valley St Unit 57
- 228 Vicksburg St Unit 3
- 222 Jersey St
- 1031 Dolores St
- 1541 Sanchez St
- 221 San Jose Ave
- 3825 Cesar Chavez St
- 3825 Cesar Chavez St Unit 3829
- 3825 Cesar Chavez St Unit 3829
- 3831 Cesar Chavez St
- 3823 Cesar Chavez St
- 3821 Cesar Chavez St
- 3835 Cesar Chavez St
- 3811 Cesar Chavez St
- 3839 Cesar Chavez St
- 3809 Cesar Chavez St
- 3845 Cesar Chavez St
- 1354 Dolores St
- 1356 Dolores St
- 1358 Dolores St
- 216 27th St
- 222 27th St
- 212 27th St
- 3851 Cesar Chavez St
- 218 27th St
- 220 27th St