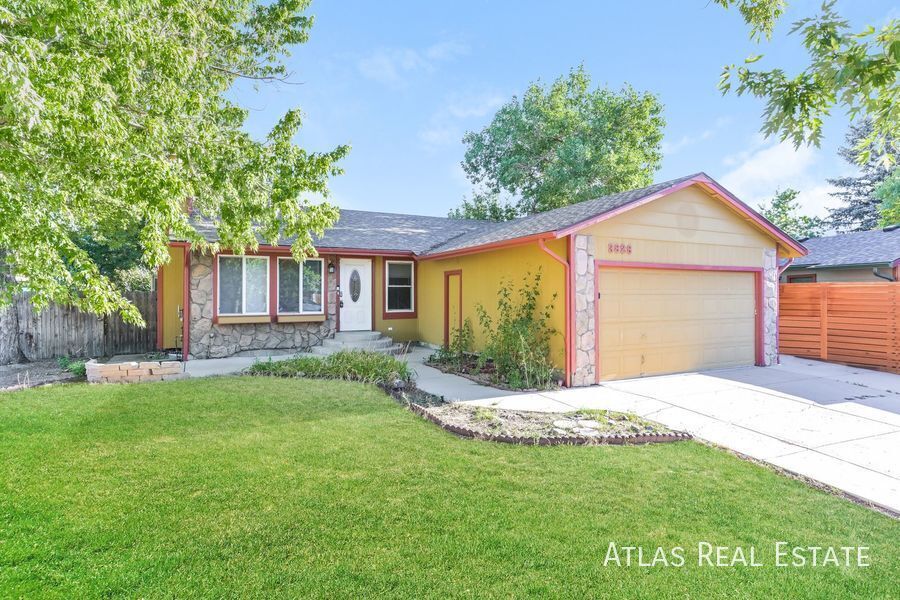
3828 S Ouray Way Aurora, CO 80013
Mission Viejo NeighborhoodAbout This Home
Pete Collins
Located at 3828 S Ouray Way, Aurora, CO 80013
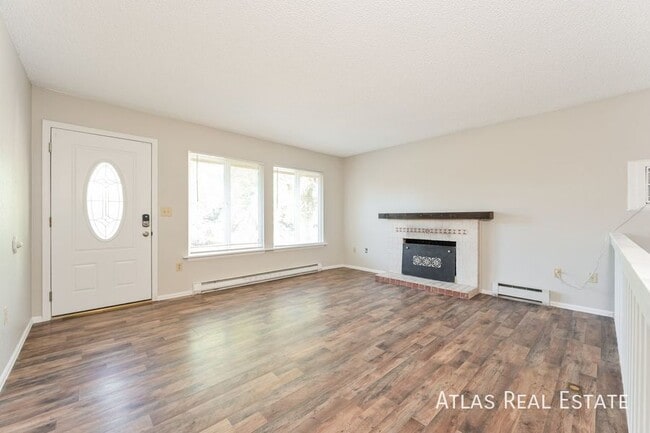
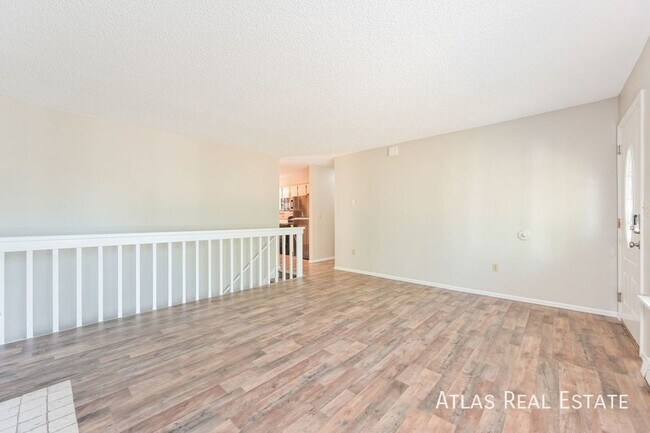
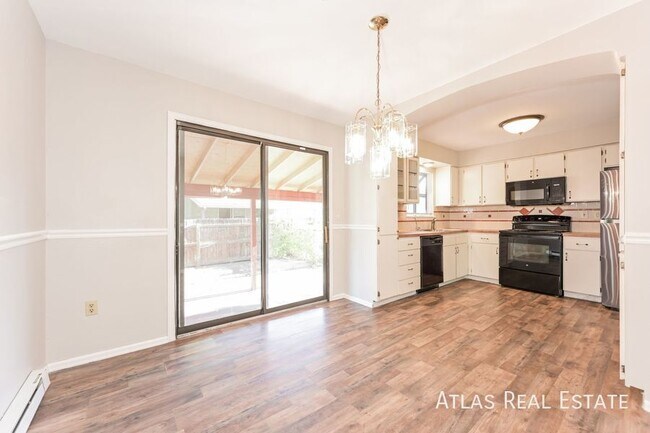
Welcome to this inviting and well-maintained 4-bedroom, 3-bathroom home ideally situated off Hampden Avenue near Mission Viejo Park in Aurora. This spacious property offers comfort, convenience, and charm—perfect for families or professionals seeking a home that blends suburban tranquility with easy access to city amenities.
Home Features:
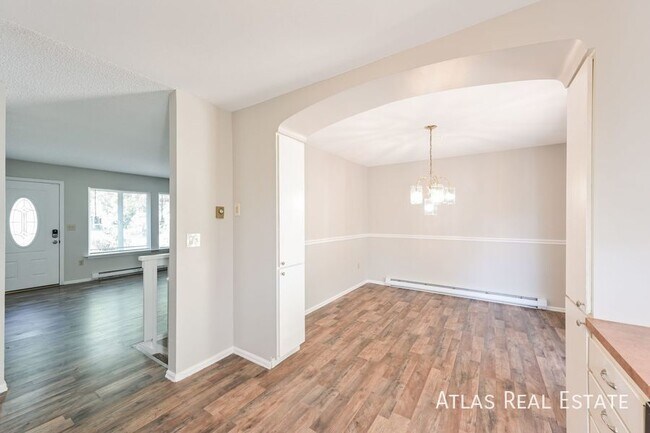
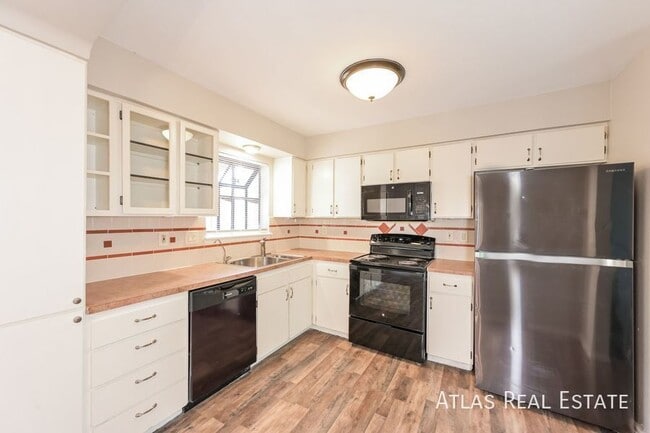
The kitchen is thoughtfully designed with a breakfast nook, dishwasher, and ample cabinetry for all your storage needs.
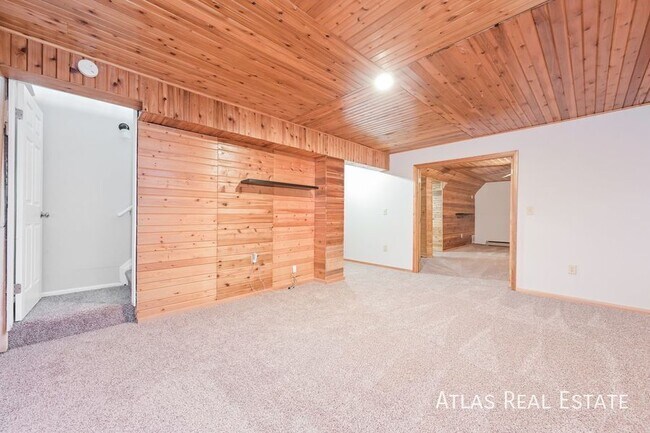
The primary bedroom includes a private en suite bathroom, offering a comfortable retreat. Downstairs, the fourth bedroom features a walk-in closet—perfect for guests, a home office, or extra storage space.
Enjoy low-maintenance outdoor living with a fenced yard designed for both relaxation and easy upkeep. The attached garage includes built-in cabinets and workspace, along with additional outdoor storage alongside the home. A swamp cooler keeps the home comfortable year-round.
Unit Amenities:
• Dishwasher
• Laundry Hook-ups
• Fenced Yard
• Swamp Cooler
• Attached Garage with Workspace
Neighborhood Highlights:
• Parks & Trails: Just steps away from Mission Viejo Park, which offers playgrounds, sports fields, and scenic walking paths. Cherry Creek State Park is also nearby, providing boating, fishing, hiking, biking, and picnic areas for outdoor enthusiasts.
• Shopping & Groceries: Enjoy convenient access to Mission Viejo Shopping Center, featuring King Soopers, restaurants, and retail shops. Southlands Mall is only a short drive away, offering a wide variety of shops, dining, and entertainment. Nearby grocery options include King Soopers, Safeway, and Natural Grocers.
• Dining: Satisfy your cravings at local favorites such as Las Fajitas for authentic Mexican cuisine, Mama Alvino’s Pizzeria for Italian classics, or Chick-fil-A for a quick and easy meal. For coffee lovers, Legends Coffee is close by and perfect for a morning pick-me-up.
• Schools: Located in the highly rated Cherry Creek School District, this home is near Mission Viejo Elementary, Laredo Middle School, and Smoky Hill High School—ideal for families seeking excellent educational opportunities.
• Commute Access: Conveniently positioned near E-470 and I-225, offering an easy commute to Denver Tech Center, downtown Denver, and surrounding areas. Nearby public transportation options and well-connected roadways make getting around simple and stress-free.
Perfect For:
• Families looking for space, comfort, and access to top-rated schools
• Professionals who value a convenient commute and proximity to shopping and dining
• Anyone seeking a balance of urban amenities and outdoor recreation
Don’t miss this opportunity to make 3828 S Ouray Way your new home. Schedule a viewing today and experience all that this beautiful Aurora property has to offer!
Rent: $2,895.00
Deposit: $2,895.00 for well-qualified applicants. Atlas Real Estate has partnered with Jetty to offer an affordable alternative to upfront cash security deposits. Residents approved through Jetty can choose between purchasing a deposit replacement policy with Jetty at a fraction of the upfront cost OR pay a security deposit as low as 1 month’s rent, for well qualified applicants.
Utilities: Residents are responsible for all utilities which are billed to you via Nutiliti, our third party utility manager, in a convenient app on your phone or via their website. No utility set up, transfers or utility deposits are needed! One-time $30 set-up charge applies. $9.99 monthly fee will be charged by Nutiliti monthly.
Atlas charges a $10 monthly lease management admin fee.
Atlas Real Estate residents are enrolled in the Resident Benefits Package (RBP) which includes HVAC air filter delivery, our best-in-class resident rewards program, credit reporting, utility management and much more for $60.00 per month. More details upon application. You will receive a code via SmartRent to access your home, upon application approval and payment of all monies owed prior to move-in.
Renters Insurance: Renters insurance is required - $100,000.00 minimum in property damage and legal liability with Atlas Real Estate listed as additional interest. Atlas Real Estate address is: PO Box 660121 Dallas, TX 75266.
Pet Policy:
A PetScreening Application is required if applying with an Emotional Support or Service Animal.
Pets accepted! (2) total are allowed
$300 refundable pet deposit is due at the time of move in.
$35 monthly pet rent.
**PETSCREENING IS A REQUIRED PART OF THE APPLICATION PROCESS FOR ALL APPLICANTS: A welcoming environment is paramount to all our residents with or without pets as well as animals. To help ensure ALL of our residents understand our pet and animal-related policies, we use a third-party screening service and require EVERYONE to complete a profile. This process ensures we have formalized pet and animal-related policy acknowledgments and more accurate records to create greater mutual accountability. If you need accommodation in another way, please contact your housing provider. Please get started by going to our pet screening page:
Applications: $50/per adult
Background Check - Findigs: $25
Labor Cost - Atlas Real State: $25.18
Overhead/Technology Cost - Atlas Real State: $3.43
Total Cost: $53.61
Total Cost you pay for your application fee: $50
Applying for one property is the same as applying for all properties. Once approved you can transfer your application to other properties that are within the income requirements provided. Applying for a home does not guarantee its availability.
Rental Qualifications:
Please provide proof of income equal to 2x the monthly rent amount. (Verifiable income must be dated within last 30 days)
If self-employed please upload 3 months of deposit statements and tax returns
No evictions within the last 5 years
No landlord debt can be owed to previous landlords
Background and credit check required
Atlas Real Estate is a lessor that complies with all federal, state, and local housing laws and requirements.
Additional terms and conditions may apply, and this listing is not an offer or promise to rent. Additional information and an application for all household members over 18 years of age must be submitted, along with applicable application fees. Applications must be completed and required documentation must be received in entirety for an application to be processed.
All leasing information contained herein is deemed to be accurate and true, changes may have occurred since photographs were taken. You are strongly encouraged to view the property in person to view changes, if any. Square footage is estimated. Pricing and the date available may change without notice.
We do NOT accept any payments via Venmo, Zelle, CashApp, or any other payment app. We also do NOT accept payment via Western Union, MoneyGram, or bank transfer. Please protect yourself from scammers. Do not schedule any viewings of any Atlas Real Estate managed property if you found it on Craigslist or other similar classified advertising services. Should you have any questions as to if the property listing belongs to Atlas Real Estate, please contact us at or reach out to the direct contact number listed below.
1.The prospective tenant has the right to provide to the landlord a portable screening report, as defined in Section 38-12-902(2.5), Colorado Revised Statutes.
2.If the prospective tenant provides the landlord with a portable tenant screening report, the landlord is prohibited from: § Charging the prospective tenant a rental application fee; or § Charging the prospective tenant a fee for the landlord to access or use the portal tenant screening report
Contact me today to tour! Call, text, or email!
Pete Collins
Professionally managed by Atlas Real Estate, LLC.
@REALTOR
PetScreening
PetScreening gives Property Managers and Landlords the ability to screen renters' pets a

Map
- 3850 S Olathe Cir
- 16812 E Mansfield Cir
- 17055 E Milan Cir
- 16786 E Kent Dr
- 3660 S Ouray Cir
- 17121 E Mercer Dr
- 3984 S Pitkin Way
- 17321 E Mansfield Ave Unit 232L
- 3577 S Ouray Cir
- 3575 S Ouray St
- 3658 S Norfolk Way
- 17381 E Mansfield Ave Unit 711L
- 17177 E Navarro Place
- 16085 E Lehigh Cir
- 3581 S Olathe St
- 4128 S Olathe Way
- 3632 S Mobile Way
- 17361 E Mansfield Ave Unit 532R
- 17361 E Mansfield Ave Unit 521R
- 17493 E Mansfield Ave Unit 1231L
- 16933 E Milan Cir
- 16797 E Mansfield Cir
- 3586 S Ouray St
- 4071 S Nucla Way
- 3652 S Mobile Way
- 3612 S Quintero St
- 17293 E Kenyon Dr
- 4110 S Laredo Way
- 17664 E Loyola Dr
- 16265 E Hamilton Place
- 4285 S Salida Way Unit 14
- 3976 S Jasper Ct
- 3696 S Jasper St
- 3499 S Uravan Way
- 4292 S Salida Way Unit 7
- 4174 S Kalispell St
- 15805 E Oxford Ave
- 18051 E Loyola Place
- 4460 S Pitkin St Unit 120
- 16152 E Radcliff Place