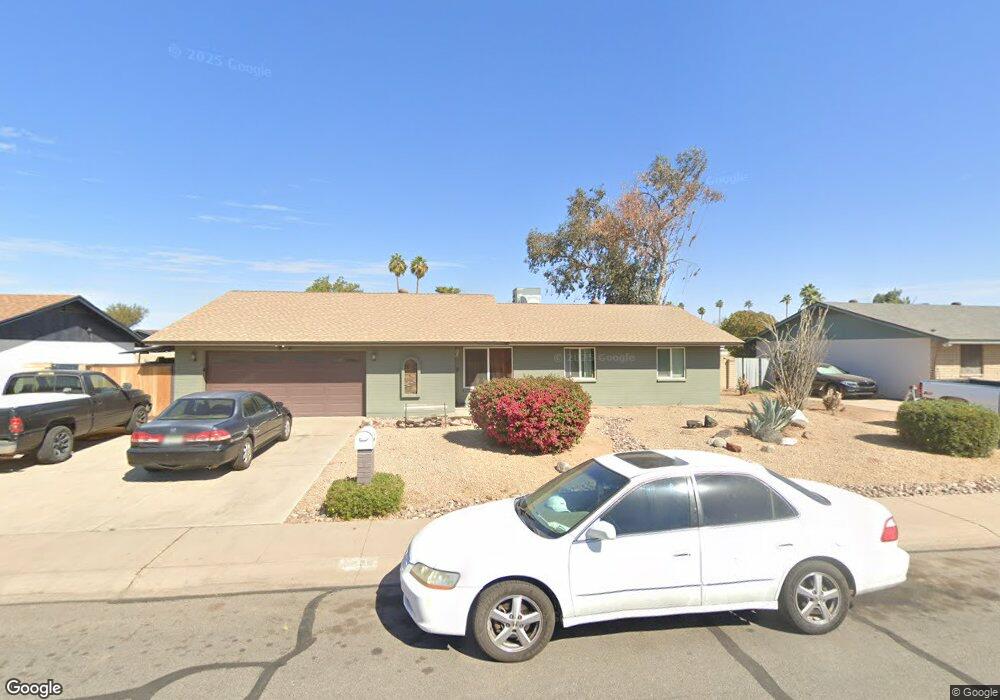
3830 W Yucca St Phoenix, AZ 85029
North Mountain Village NeighborhoodEstimated Value: $305,929 - $440,000
3
Beds
2
Baths
1,654
Sq Ft
$239/Sq Ft
Est. Value
About This Home
This home is located at 3830 W Yucca St, Phoenix, AZ 85029 and is currently estimated at $395,732, approximately $239 per square foot. 3830 W Yucca St is a home located in Maricopa County with nearby schools including Tumbleweed Elementary School, Cholla Middle School, and Moon Valley High School.
Ownership History
Date
Name
Owned For
Owner Type
Purchase Details
Closed on
Nov 23, 2021
Sold by
Highley Richard
Bought by
Highley Richard R and Azucena Blanca Yessenia
Current Estimated Value
Purchase Details
Closed on
Jan 25, 2002
Sold by
Balderrama Jaime
Bought by
Highley Richard
Home Financials for this Owner
Home Financials are based on the most recent Mortgage that was taken out on this home.
Original Mortgage
$127,499
Outstanding Balance
$51,750
Interest Rate
6.8%
Mortgage Type
FHA
Estimated Equity
$343,982
Purchase Details
Closed on
Sep 24, 1998
Sold by
Stanfield Jack K and Stanfield Beverly A
Bought by
Balderrama Jaimie
Purchase Details
Closed on
Sep 26, 1995
Sold by
Stanfield Jack K and Stanfield Beverly A
Bought by
Stanfield Jack K and Stanfield Beverly A
Home Financials for this Owner
Home Financials are based on the most recent Mortgage that was taken out on this home.
Original Mortgage
$69,750
Interest Rate
6.25%
Create a Home Valuation Report for This Property
The Home Valuation Report is an in-depth analysis detailing your home's value as well as a comparison with similar homes in the area
Home Values in the Area
Average Home Value in this Area
Purchase History
| Date | Buyer | Sale Price | Title Company |
|---|---|---|---|
| Highley Richard R | -- | None Available | |
| Highley Richard | $129,500 | Title Guaranty Agency | |
| Balderrama Jaimie | $106,000 | North American Title Agency | |
| Stanfield Jack K | -- | Security Title Agency |
Source: Public Records
Mortgage History
| Date | Status | Borrower | Loan Amount |
|---|---|---|---|
| Open | Highley Richard | $127,499 | |
| Previous Owner | Stanfield Jack K | $69,750 | |
| Closed | Highley Richard | $6,800 |
Source: Public Records
Tax History Compared to Growth
Tax History
| Year | Tax Paid | Tax Assessment Tax Assessment Total Assessment is a certain percentage of the fair market value that is determined by local assessors to be the total taxable value of land and additions on the property. | Land | Improvement |
|---|---|---|---|---|
| 2025 | $1,265 | $11,345 | -- | -- |
| 2024 | $1,192 | $10,804 | -- | -- |
| 2023 | $1,192 | $28,110 | $5,620 | $22,490 |
| 2022 | $1,150 | $21,620 | $4,320 | $17,300 |
| 2021 | $1,179 | $19,870 | $3,970 | $15,900 |
| 2020 | $1,147 | $18,620 | $3,720 | $14,900 |
| 2019 | $1,126 | $16,550 | $3,310 | $13,240 |
| 2018 | $1,094 | $15,360 | $3,070 | $12,290 |
| 2017 | $1,091 | $13,380 | $2,670 | $10,710 |
| 2016 | $1,072 | $12,620 | $2,520 | $10,100 |
| 2015 | $994 | $12,330 | $2,460 | $9,870 |
Source: Public Records
Map
Nearby Homes
- 3810 W Yucca St
- 3824 W Shangri la Rd
- 3915 W Cholla St
- 3836 W Desert Cove Ave
- 3844 W Lupine Ave
- 3736 W Mercer Ln
- 10841 N 39th Dr
- 3807 W Mercer Ln
- 11220 N 37th Ave
- 3840 W Sierra St
- 3802 W Sahuaro Dr
- 3654 W Shangri la Rd
- 3743 W Sahuaro Dr
- 3734 W Becker Ln
- 3926 W Sahuaro Dr
- 10801 N 37th Dr
- 11615 N 39th Dr
- 11022 N 41st Ave
- 3741 W Poinsettia Dr
- 4126 W Mescal St
- 3836 W Yucca St Unit 4
- 3822 W Yucca St
- 3829 W Garden Dr
- 3821 W Garden Dr Unit 4
- 3835 W Garden Dr
- 3842 W Yucca St
- 3816 W Yucca St
- 3829 W Yucca St
- 3835 W Yucca St
- 3821 W Yucca St
- 3841 W Garden Dr
- 3841 W Yucca St
- 3815 W Yucca St
- 3815 W Garden Dr
- 3850 W Yucca St Unit 4
- 3849 W Garden Dr
- 11028 N 38th Dr
- 3849 W Yucca St
- 3809 W Yucca St
- 3830 W Garden Dr