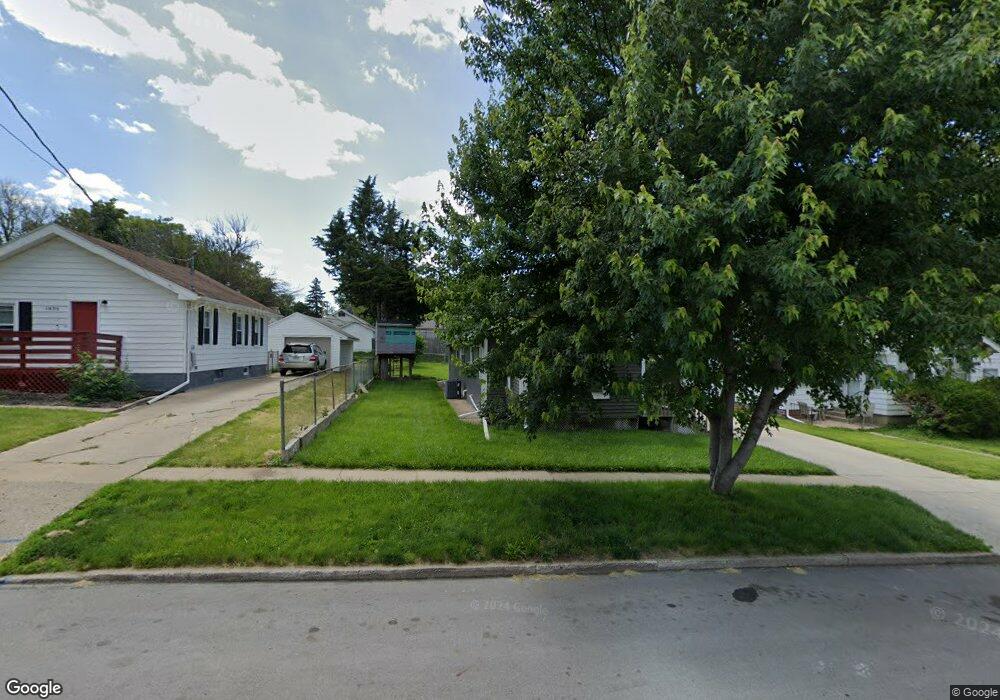
3832 1st St Des Moines, IA 50313
Highland Park NeighborhoodEstimated Value: $154,000 - $178,000
2
Beds
1
Bath
1,149
Sq Ft
$145/Sq Ft
Est. Value
About This Home
This home is located at 3832 1st St, Des Moines, IA 50313 and is currently estimated at $166,786, approximately $145 per square foot. 3832 1st St is a home located in Polk County with nearby schools including Madison Elementary School, Harding Middle School, and North High School.
Ownership History
Date
Name
Owned For
Owner Type
Purchase Details
Closed on
Sep 25, 2017
Sold by
3 Angels Llc
Bought by
Kockler Michael
Current Estimated Value
Home Financials for this Owner
Home Financials are based on the most recent Mortgage that was taken out on this home.
Original Mortgage
$96,000
Outstanding Balance
$79,994
Interest Rate
3.82%
Mortgage Type
New Conventional
Estimated Equity
$86,792
Purchase Details
Closed on
Dec 16, 2016
Sold by
Rally Cap Properties Llc
Bought by
3 Angels Llc
Purchase Details
Closed on
Oct 26, 2016
Sold by
Wells Fargo Bank Na
Bought by
Rally Cap Properties Llc
Purchase Details
Closed on
Nov 3, 2015
Sold by
Murphy Donna
Bought by
Wells Fargo Bank Na
Purchase Details
Closed on
Nov 4, 1998
Sold by
Crabbs Ronald R and Crabbs Nancy K
Bought by
Murphy Gary G
Home Financials for this Owner
Home Financials are based on the most recent Mortgage that was taken out on this home.
Original Mortgage
$41,393
Interest Rate
6.72%
Mortgage Type
FHA
Create a Home Valuation Report for This Property
The Home Valuation Report is an in-depth analysis detailing your home's value as well as a comparison with similar homes in the area
Home Values in the Area
Average Home Value in this Area
Purchase History
| Date | Buyer | Sale Price | Title Company |
|---|---|---|---|
| Kockler Michael | $120,000 | -- | |
| 3 Angels Llc | $24,500 | None Available | |
| Rally Cap Properties Llc | $13,000 | None Available | |
| Wells Fargo Bank Na | $39,101 | None Available | |
| Murphy Gary G | $40,500 | -- |
Source: Public Records
Mortgage History
| Date | Status | Borrower | Loan Amount |
|---|---|---|---|
| Open | Kockler Michael | $96,000 | |
| Previous Owner | Murphy Gary G | $41,393 |
Source: Public Records
Tax History Compared to Growth
Tax History
| Year | Tax Paid | Tax Assessment Tax Assessment Total Assessment is a certain percentage of the fair market value that is determined by local assessors to be the total taxable value of land and additions on the property. | Land | Improvement |
|---|---|---|---|---|
| 2025 | $2,804 | $164,100 | $29,200 | $134,900 |
| 2024 | $2,804 | $142,500 | $25,300 | $117,200 |
| 2023 | $2,716 | $142,500 | $25,300 | $117,200 |
| 2022 | $2,694 | $115,200 | $21,400 | $93,800 |
| 2021 | $2,546 | $115,200 | $21,400 | $93,800 |
| 2020 | $2,644 | $102,000 | $19,100 | $82,900 |
| 2019 | $2,496 | $102,000 | $19,100 | $82,900 |
| 2018 | $1,248 | $92,900 | $17,400 | $75,500 |
| 2017 | $1,766 | $46,900 | $17,400 | $29,500 |
| 2016 | $1,836 | $65,300 | $15,600 | $49,700 |
| 2015 | $1,492 | $65,300 | $15,600 | $49,700 |
| 2014 | $2,545 | $65,100 | $15,300 | $49,800 |
Source: Public Records
Map
Nearby Homes