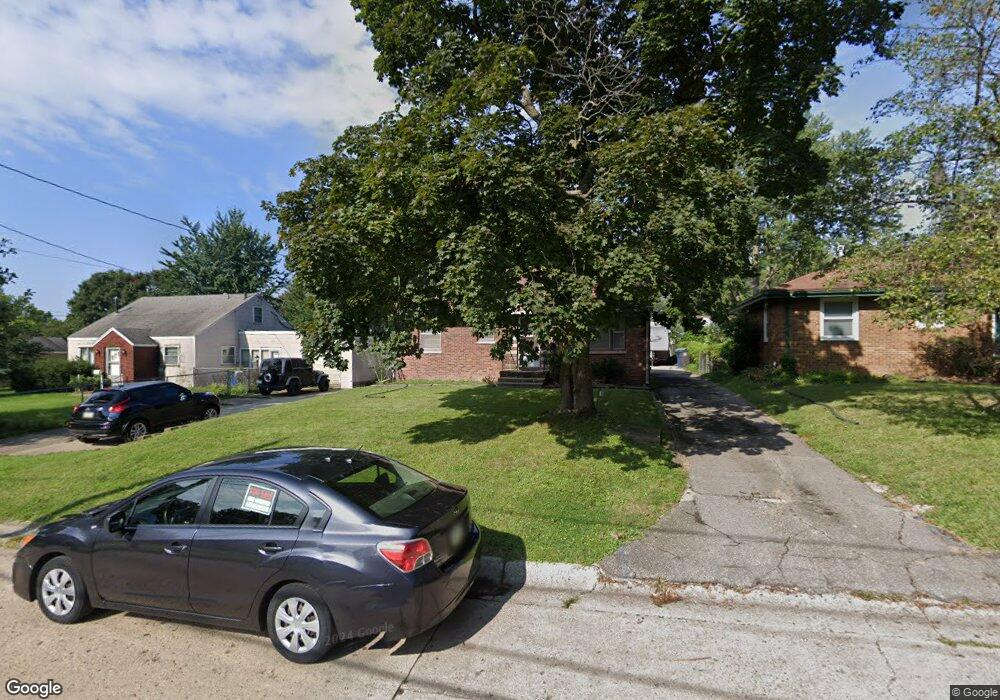
3832 42nd St Des Moines, IA 50310
Lower Beaver NeighborhoodEstimated Value: $205,000 - $227,351
3
Beds
1
Bath
864
Sq Ft
$247/Sq Ft
Est. Value
About This Home
This home is located at 3832 42nd St, Des Moines, IA 50310 and is currently estimated at $213,588, approximately $247 per square foot. 3832 42nd St is a home located in Polk County with nearby schools including Samuelson Elementary School, Meredith Middle School, and Hoover High School.
Ownership History
Date
Name
Owned For
Owner Type
Purchase Details
Closed on
Feb 28, 2012
Sold by
Chen Evelina
Bought by
Schuster James
Current Estimated Value
Home Financials for this Owner
Home Financials are based on the most recent Mortgage that was taken out on this home.
Original Mortgage
$93,256
Outstanding Balance
$63,890
Interest Rate
3.89%
Mortgage Type
Future Advance Clause Open End Mortgage
Estimated Equity
$149,698
Purchase Details
Closed on
Mar 24, 2011
Sold by
Beavers Mildred and Riley Alaina
Bought by
Chen Evelina
Create a Home Valuation Report for This Property
The Home Valuation Report is an in-depth analysis detailing your home's value as well as a comparison with similar homes in the area
Home Values in the Area
Average Home Value in this Area
Purchase History
| Date | Buyer | Sale Price | Title Company |
|---|---|---|---|
| Schuster James | $94,500 | None Available | |
| Chen Evelina | $84,500 | None Available |
Source: Public Records
Mortgage History
| Date | Status | Borrower | Loan Amount |
|---|---|---|---|
| Open | Schuster James | $93,256 |
Source: Public Records
Tax History Compared to Growth
Tax History
| Year | Tax Paid | Tax Assessment Tax Assessment Total Assessment is a certain percentage of the fair market value that is determined by local assessors to be the total taxable value of land and additions on the property. | Land | Improvement |
|---|---|---|---|---|
| 2025 | $3,782 | $223,600 | $51,900 | $171,700 |
| 2024 | $3,782 | $202,700 | $46,300 | $156,400 |
| 2023 | $3,608 | $202,700 | $46,300 | $156,400 |
| 2022 | $3,580 | $162,000 | $38,700 | $123,300 |
| 2021 | $3,658 | $162,000 | $38,700 | $123,300 |
| 2020 | $3,796 | $155,200 | $36,800 | $118,400 |
| 2019 | $3,530 | $155,200 | $36,800 | $118,400 |
| 2018 | $3,490 | $139,900 | $32,600 | $107,300 |
| 2017 | $3,118 | $139,900 | $32,600 | $107,300 |
| 2016 | $3,032 | $123,800 | $28,300 | $95,500 |
| 2015 | $3,032 | $123,800 | $28,300 | $95,500 |
| 2014 | $2,878 | $121,300 | $27,200 | $94,100 |
Source: Public Records
Map
Nearby Homes
- 4001 42nd St
- 4020 Douglas Ave
- 4008 Douglas Ave
- 3831 40th St
- 4038 Beaver Ave
- 4004 Clinton Ave
- 4015 39th Place
- 3845 Sherman Blvd
- 4064 45th St
- 4037 Amick Ave
- 3905 Clinton Ave
- 4415 Amick Ave
- 4425 Amick Ave
- 4507 Amick Ave
- 3945 38th St
- 3833 38th St
- 3616 Madison Ave
- 3403 47th St
- 3616 37th St
- 3838 Valdez Dr