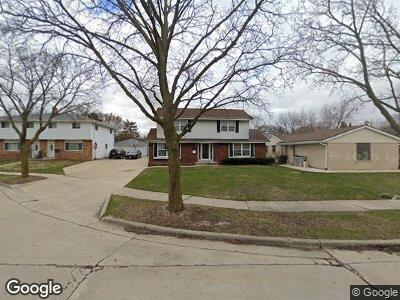
3833 S Marcy St Milwaukee, WI 53220
Root Creek NeighborhoodEstimated Value: $309,000 - $351,000
3
Beds
2
Baths
2,955
Sq Ft
$112/Sq Ft
Est. Value
About This Home
This home is located at 3833 S Marcy St, Milwaukee, WI 53220 and is currently estimated at $330,527, approximately $111 per square foot. 3833 S Marcy St is a home located in Milwaukee County with nearby schools including Milwaukee Spanish Immersion School - Upper Campus, Craig Montessori School, and Milwaukee German Immersion School.
Ownership History
Date
Name
Owned For
Owner Type
Purchase Details
Closed on
May 18, 2007
Sold by
Xiong Tou Vang and Xiong Jou Kue
Bought by
Ibarra Arturo and Ibarra Veronica E
Current Estimated Value
Home Financials for this Owner
Home Financials are based on the most recent Mortgage that was taken out on this home.
Original Mortgage
$200,970
Interest Rate
6.21%
Mortgage Type
Purchase Money Mortgage
Purchase Details
Closed on
Nov 29, 2002
Sold by
Christopher Thomas P
Bought by
Xiong Tou Vang and Xiong Jou Kue
Home Financials for this Owner
Home Financials are based on the most recent Mortgage that was taken out on this home.
Original Mortgage
$146,400
Interest Rate
6.13%
Mortgage Type
Purchase Money Mortgage
Purchase Details
Closed on
May 13, 2002
Sold by
Christopher Kathleen M
Bought by
Christopher Thomas P
Create a Home Valuation Report for This Property
The Home Valuation Report is an in-depth analysis detailing your home's value as well as a comparison with similar homes in the area
Home Values in the Area
Average Home Value in this Area
Purchase History
| Date | Buyer | Sale Price | Title Company |
|---|---|---|---|
| Ibarra Arturo | $220,000 | None Available | |
| Xiong Tou Vang | $183,000 | -- | |
| Christopher Thomas P | -- | -- |
Source: Public Records
Mortgage History
| Date | Status | Borrower | Loan Amount |
|---|---|---|---|
| Open | Ibarra Arturo | $201,957 | |
| Closed | Ibarra Arturo | $200,970 | |
| Previous Owner | Xiong Tou Vang | $218,700 | |
| Previous Owner | Xiong Tou Vang | $146,400 |
Source: Public Records
Tax History Compared to Growth
Tax History
| Year | Tax Paid | Tax Assessment Tax Assessment Total Assessment is a certain percentage of the fair market value that is determined by local assessors to be the total taxable value of land and additions on the property. | Land | Improvement |
|---|---|---|---|---|
| 2023 | $5,288 | $223,800 | $45,600 | $178,200 |
| 2022 | $5,014 | $223,800 | $45,600 | $178,200 |
| 2021 | $4,884 | $197,900 | $45,600 | $152,300 |
| 2020 | $4,920 | $197,900 | $45,600 | $152,300 |
| 2019 | $4,579 | $201,200 | $46,400 | $154,800 |
| 2018 | $4,976 | $201,200 | $46,400 | $154,800 |
| 2017 | $5,079 | $193,500 | $50,800 | $142,700 |
| 2016 | $5,127 | $186,200 | $50,800 | $135,400 |
| 2015 | $5,254 | $186,200 | $50,800 | $135,400 |
| 2014 | $5,750 | $190,300 | $50,800 | $139,500 |
| 2013 | -- | $190,300 | $50,800 | $139,500 |
Source: Public Records
Map
Nearby Homes
- 6723 W Howard Ave
- 6175 W Howard Ave Unit 7
- 7052 W van Beck Ave
- 4074 S 70th St
- 6426 W Morgan Ave
- 4033 S 71st St
- 6643 W Verona Ct
- 3731 S 56th St
- 6510 W Cold Spring Rd
- 6951 W Verona Ct
- 3815 S 55th St
- 5509 W Wilbur Ave
- 3342 S 68th St
- 3416 S 58th St
- 6566 W Ohio Ave
- 6800 W Ohio Ave
- 3260 S 68th St
- 7707 W Wilbur Ave
- 3428 S 56th St
- 6555 W Euclid Ave
- 3833 S Marcy St
- 3840 S Marcy St Unit 3842
- 3841 S Marcy St Unit 3843
- 3852 S Marcy St Unit 3854
- 3846 S Marcy St Unit 3848
- 3849 S Marcy St Unit 3851
- 3855 S Marcy St Unit 3857
- 3821 S Marcy St
- 3830 S Marcy St Unit 3832
- 3813 S Marcy St
- 3810 S Marcy St Unit 3812
- 3802 S Marcy St
- 6621 W Tripoli Ave
- 3830 S 67th St
- 3824 S 67th St
- 3801 S Marcy St
- 3814 S 67th St
- 3806 S 67th St
- 3764 S Marcy St
- 3759 S Marcy St