
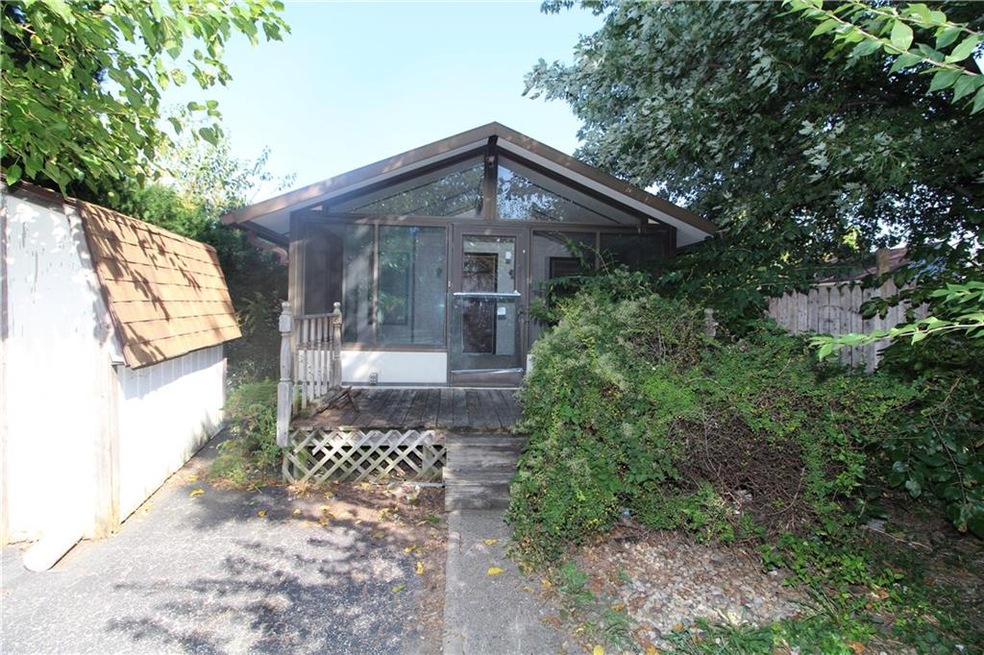

3834 E 11th St Indianapolis, IN 46201
Near Eastside Neighborhood
2
Beds
1.5
Baths
1,316
Sq Ft
5,881
Sq Ft Lot
Highlights
- Wood Flooring
- Forced Air Heating System
- Family or Dining Combination
- 1-Story Property
About This Home
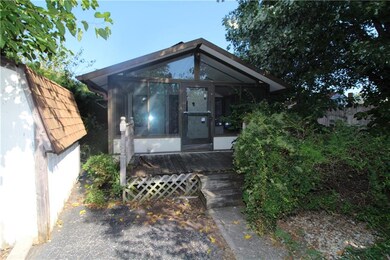
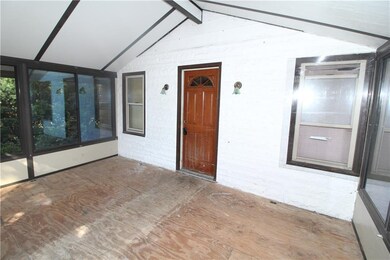
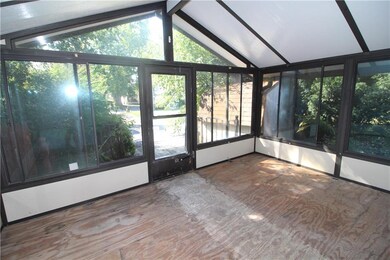
As of April 2022Check out this single-family home in Little Flower neighborhood. The glass-enclosed front porch gives added room to this home. This home features a separate formal dining room. Would make a great starter or investment for a rental or if someone wants to downsize.
Last Agent to Sell the Property
Red Bridge Real Estate License #RB14045562 Listed on: 10/04/2019
Home Details
Home Type
- Single Family
Year Built
- Built in 1940
Lot Details
- 5,881 Sq Ft Lot
Home Design
- Wood Foundation
Interior Spaces
- 1,316 Sq Ft Home
- 1-Story Property
- Family or Dining Combination
- Wood Flooring
Bedrooms and Bathrooms
- 2 Bedrooms
Utilities
- Forced Air Heating System
- Heating System Uses Gas
- Gas Water Heater
Community Details
- Carellis Denny St Subdivision
Listing and Financial Details
- Assessor Parcel Number 490733136005000101
Ownership History
Date
Name
Owned For
Owner Type
Purchase Details
Listed on
Dec 31, 2020
Closed on
Feb 16, 2021
Sold by
Sos Renovations Llc
Bought by
Brooks Ian and Brooks Leslie
Seller's Agent
Gretchen Szostak
DNA Properties, LLC
Buyer's Agent
Gregory Otterman
@properties
List Price
$154,900
Sold Price
$145,000
Premium/Discount to List
-$9,900
-6.39%
Total Days on Market
73
Current Estimated Value
Home Financials for this Owner
Home Financials are based on the most recent Mortgage that was taken out on this home.
Estimated Appreciation
$40,118
Avg. Annual Appreciation
6.28%
Original Mortgage
$142,373
Outstanding Balance
$128,970
Interest Rate
2.65%
Mortgage Type
FHA
Estimated Equity
$59,204
Purchase Details
Listed on
Oct 4, 2019
Closed on
Jan 14, 2020
Sold by
Simple Quarters Llc
Bought by
Sos Renovations Llc
Seller's Agent
Randy Placencia
Red Bridge Real Estate
Buyer's Agent
Gretchen Szostak
DNA Properties, LLC
List Price
$48,900
Sold Price
$39,000
Premium/Discount to List
-$9,900
-20.25%
Home Financials for this Owner
Home Financials are based on the most recent Mortgage that was taken out on this home.
Avg. Annual Appreciation
233.59%
Original Mortgage
$25,000
Interest Rate
3.72%
Mortgage Type
Seller Take Back
Purchase Details
Closed on
Sep 23, 2019
Sold by
Cooper Susan
Bought by
Simple Quarters Llc
Home Financials for this Owner
Home Financials are based on the most recent Mortgage that was taken out on this home.
Original Mortgage
$25,000
Interest Rate
3.6%
Mortgage Type
New Conventional
Purchase Details
Listed on
Aug 24, 2016
Closed on
Mar 15, 2017
Sold by
Secretary Of Housing And Urban Developme
Bought by
Cooper Susan
Seller's Agent
Jynell Berkshire
Buyer's Agent
Aaron Schlesinger
Envoy Real Estate, LLC
List Price
$33,000
Sold Price
$7,650
Premium/Discount to List
-$25,350
-76.82%
Home Financials for this Owner
Home Financials are based on the most recent Mortgage that was taken out on this home.
Avg. Annual Appreciation
47.71%
Purchase Details
Listed on
Aug 24, 2016
Closed on
Mar 10, 2017
Sold by
Hud
Bought by
Cooper Susan
Seller's Agent
Jynell Berkshire
Buyer's Agent
Aaron Schlesinger
Envoy Real Estate, LLC
List Price
$33,000
Sold Price
$7,650
Premium/Discount to List
-$25,350
-76.82%
Purchase Details
Closed on
Apr 25, 2016
Sold by
Midfirst Bank
Bought by
Secretary Of Housing & Urban Development
Purchase Details
Closed on
Jan 21, 2015
Sold by
Covington Ernestine
Bought by
Midfirst Bank
Similar Homes in Indianapolis, IN
Create a Home Valuation Report for This Property
The Home Valuation Report is an in-depth analysis detailing your home's value as well as a comparison with similar homes in the area
Home Values in the Area
Average Home Value in this Area
Purchase History
| Date | Type | Sale Price | Title Company |
|---|---|---|---|
| Warranty Deed | $145,000 | Security Title | |
| Warranty Deed | $39,000 | Quality Title Insurance Inc | |
| Warranty Deed | $25,000 | Investors Title | |
| Deed | $7,700 | -- | |
| Deed | -- | -- | |
| Special Warranty Deed | -- | None Available | |
| Sheriffs Deed | $53,804 | None Available |
Source: Public Records
Mortgage History
| Date | Status | Loan Amount | Loan Type |
|---|---|---|---|
| Open | $142,373 | FHA | |
| Previous Owner | $25,000 | Seller Take Back | |
| Previous Owner | $97,650 | Commercial | |
| Previous Owner | $25,000 | New Conventional |
Source: Public Records
Property History
| Date | Event | Price | Change | Sq Ft Price |
|---|---|---|---|---|
| 04/11/2022 04/11/22 | Sold | $165,000 | +10.1% | $125 / Sq Ft |
| 03/11/2022 03/11/22 | Pending | -- | -- | -- |
| 03/07/2022 03/07/22 | For Sale | $149,900 | +3.4% | $114 / Sq Ft |
| 02/16/2021 02/16/21 | Sold | $145,000 | -3.3% | $110 / Sq Ft |
| 01/14/2021 01/14/21 | Pending | -- | -- | -- |
| 01/07/2021 01/07/21 | Price Changed | $149,900 | -3.2% | $114 / Sq Ft |
| 12/31/2020 12/31/20 | For Sale | $154,900 | +297.2% | $118 / Sq Ft |
| 01/14/2020 01/14/20 | Sold | $39,000 | -2.3% | $30 / Sq Ft |
| 12/17/2019 12/17/19 | Pending | -- | -- | -- |
| 12/11/2019 12/11/19 | Price Changed | $39,900 | -2.4% | $30 / Sq Ft |
| 11/27/2019 11/27/19 | Price Changed | $40,900 | -2.4% | $31 / Sq Ft |
| 11/22/2019 11/22/19 | Price Changed | $41,900 | -2.3% | $32 / Sq Ft |
| 10/22/2019 10/22/19 | Price Changed | $42,900 | -90.0% | $33 / Sq Ft |
| 10/22/2019 10/22/19 | Price Changed | $428,900 | +777.1% | $326 / Sq Ft |
| 10/04/2019 10/04/19 | For Sale | $48,900 | +539.2% | $37 / Sq Ft |
| 03/15/2017 03/15/17 | Sold | $7,650 | 0.0% | $6 / Sq Ft |
| 02/28/2017 02/28/17 | Pending | -- | -- | -- |
| 02/28/2017 02/28/17 | Off Market | $7,650 | -- | -- |
| 12/29/2016 12/29/16 | Price Changed | $23,100 | -12.5% | $18 / Sq Ft |
| 11/24/2016 11/24/16 | Price Changed | $26,400 | -11.1% | $20 / Sq Ft |
| 10/25/2016 10/25/16 | Price Changed | $29,700 | -10.0% | $23 / Sq Ft |
| 08/24/2016 08/24/16 | For Sale | $33,000 | -- | $25 / Sq Ft |
Source: MIBOR Broker Listing Cooperative®
Tax History Compared to Growth
Tax History
| Year | Tax Paid | Tax Assessment Tax Assessment Total Assessment is a certain percentage of the fair market value that is determined by local assessors to be the total taxable value of land and additions on the property. | Land | Improvement |
|---|---|---|---|---|
| 2024 | $2,309 | $179,100 | $12,400 | $166,700 |
| 2023 | $2,309 | $188,700 | $12,400 | $176,300 |
| 2022 | $2,258 | $182,000 | $12,400 | $169,600 |
| 2021 | $1,899 | $157,200 | $12,400 | $144,800 |
| 2020 | $1,775 | $72,300 | $3,700 | $68,600 |
| 2019 | $1,642 | $65,400 | $3,700 | $61,700 |
| 2018 | $1,803 | $56,000 | $3,700 | $52,300 |
| 2017 | $1,195 | $51,900 | $3,700 | $48,200 |
| 2016 | $1,317 | $58,900 | $3,700 | $55,200 |
| 2014 | $1,323 | $61,000 | $3,700 | $57,300 |
| 2013 | $1,411 | $61,000 | $3,700 | $57,300 |
Source: Public Records
Agents Affiliated with this Home
-
Seller's Agent in 2022
Stacy West
Berkshire Hathaway Home
7 in this area
85 Total Sales
-
Buyer's Agent in 2022
Joel Mathews
@properties
(317) 246-9866
59 in this area
170 Total Sales
-
Gretchen Szostak
Seller's Agent in 2021
Gretchen Szostak
DNA Properties, LLC
(317) 721-5310
6 in this area
58 Total Sales
-
G
Buyer's Agent in 2021
Gregory Otterman
@properties
-
Randy Placencia
Seller's Agent in 2020
Randy Placencia
Red Bridge Real Estate
(317) 800-4342
37 in this area
315 Total Sales
-
J
Seller's Agent in 2017
Jynell Berkshire
Map
Source: MIBOR Broker Listing Cooperative®
MLS Number: MBR21673185
APN: 49-07-33-136-005.000-101
Disclaimer: Certain information contained herein is derived from information provided by parties other than Homes.com. All information provided is deemed reliable, but is not guaranteed to be accurate and should be independently verified.
![]() Based on information submitted to the MLS GRID. All data is obtained from various sources and may not have been verified by broker or MLS GRID. Supplied Open House Information is subject to change without notice. All information should be independently reviewed and verified for accuracy. Properties may or may not be listed by the office/agent presenting the information. Some IDX listings have been excluded from this website.
Based on information submitted to the MLS GRID. All data is obtained from various sources and may not have been verified by broker or MLS GRID. Supplied Open House Information is subject to change without notice. All information should be independently reviewed and verified for accuracy. Properties may or may not be listed by the office/agent presenting the information. Some IDX listings have been excluded from this website.
Nearby Homes
- 3916 E 10th St
- 3934 E 10th St
- 1115 N Kealing Ave
- 1311 N Denny St
- 1310 N Chester Ave
- 940 N Chester Ave
- 1235 N Grant Ave
- 916 N Bradley Ave
- 923 N Denny St
- 1168 N Gladstone Ave
- 3532 E 10th St
- 1331 N Grant Ave
- 945 N Ewing St
- 1433 N Denny St
- 1125 N Colorado Ave
- 821 N Bradley Ave
- 822 N Bradley Ave
- 1455 N Grant Ave
- 1114 N Olney St
- 1311 N Olney St