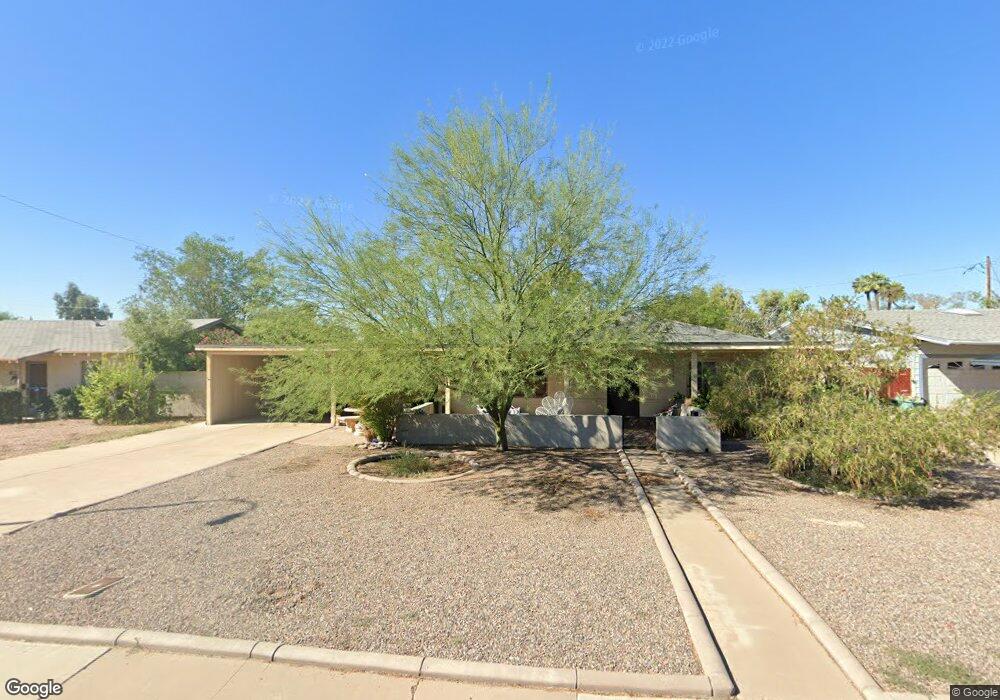
3834 N 33rd St Phoenix, AZ 85018
Camelback East Village NeighborhoodEstimated Value: $442,000 - $577,000
3
Beds
1
Bath
1,130
Sq Ft
$455/Sq Ft
Est. Value
About This Home
This home is located at 3834 N 33rd St, Phoenix, AZ 85018 and is currently estimated at $514,577, approximately $455 per square foot. 3834 N 33rd St is a home located in Maricopa County with nearby schools including Monte Vista Elementary School, Camelback High School, and Phoenix Coding Academy.
Ownership History
Date
Name
Owned For
Owner Type
Purchase Details
Closed on
Jun 9, 2005
Sold by
Lovett Jenny M and Lovett Monica L
Bought by
Warner David
Current Estimated Value
Purchase Details
Closed on
Sep 3, 2002
Sold by
Gilbreath Raymond C and Gilbreath Tamara J
Bought by
Pellegrino Joyce M
Home Financials for this Owner
Home Financials are based on the most recent Mortgage that was taken out on this home.
Original Mortgage
$113,881
Interest Rate
6.24%
Mortgage Type
FHA
Purchase Details
Closed on
Aug 19, 2002
Sold by
Sewell William R
Bought by
Sewell William R and Gilbreath Raymond
Home Financials for this Owner
Home Financials are based on the most recent Mortgage that was taken out on this home.
Original Mortgage
$113,881
Interest Rate
6.24%
Mortgage Type
FHA
Create a Home Valuation Report for This Property
The Home Valuation Report is an in-depth analysis detailing your home's value as well as a comparison with similar homes in the area
Home Values in the Area
Average Home Value in this Area
Purchase History
| Date | Buyer | Sale Price | Title Company |
|---|---|---|---|
| Warner David | $93,050 | Arizona Title Agency Inc | |
| Pellegrino Joyce M | $114,900 | Security Title Agency | |
| Sewell William R | -- | -- |
Source: Public Records
Mortgage History
| Date | Status | Borrower | Loan Amount |
|---|---|---|---|
| Previous Owner | Pellegrino Joyce M | $113,881 |
Source: Public Records
Tax History
| Year | Tax Paid | Tax Assessment Tax Assessment Total Assessment is a certain percentage of the fair market value that is determined by local assessors to be the total taxable value of land and additions on the property. | Land | Improvement |
|---|---|---|---|---|
| 2025 | $1,654 | $13,847 | -- | -- |
| 2024 | $1,572 | $13,187 | -- | -- |
| 2023 | $1,572 | $37,980 | $7,590 | $30,390 |
| 2022 | $1,505 | $28,120 | $5,620 | $22,500 |
| 2021 | $1,561 | $24,800 | $4,960 | $19,840 |
| 2020 | $1,520 | $21,900 | $4,380 | $17,520 |
| 2019 | $1,512 | $20,320 | $4,060 | $16,260 |
| 2018 | $1,479 | $18,150 | $3,630 | $14,520 |
| 2017 | $1,419 | $17,160 | $3,430 | $13,730 |
| 2016 | $1,361 | $14,320 | $2,860 | $11,460 |
| 2015 | $1,268 | $13,860 | $2,770 | $11,090 |
Source: Public Records
Map
Nearby Homes
- 4020 N 33rd St
- 3834 N 34th St
- 3818 N 32nd Place
- 3329 E Clarendon Ave
- 3223 E Weldon Ave
- 3102 E Clarendon Ave Unit 209
- 3828 N 32nd St Unit 104
- 3506 E Fairmount Ave
- 3809 N 35th St
- 4132 N 34th Place
- 3441 N 31st St Unit 109
- 3146 E Monterosa St
- 3402 N 32nd St Unit 163
- 3402 N 32nd St Unit 102
- 3718 N 36th St
- 3346 N 34th St
- 3601 E Fairmount Ave
- 4220 N 32nd St Unit 1
- 4220 N 32nd St Unit 7
- 4220 N 32nd St Unit 35
- 3840 N 33rd St
- 3833 N 32nd Way
- 3827 N 32nd Way
- 3839 N 32nd Way
- 3822 N 33rd St
- 3846 N 33rd St
- 3833 N 33rd St
- 3839 N 33rd St
- 3821 N 32nd Way
- 3827 N 33rd St
- 3845 N 32nd Way
- 3845 N 33rd St
- 3821 N 33rd St
- 3818 N 33rd St
- 3817 N 32nd Way
- 3834 N 33rd Place
- 3834 N 32nd Way
- 4002 N 33rd St
- 3840 N 33rd Place
- 3828 N 32nd Way
Your Personal Tour Guide
Ask me questions while you tour the home.