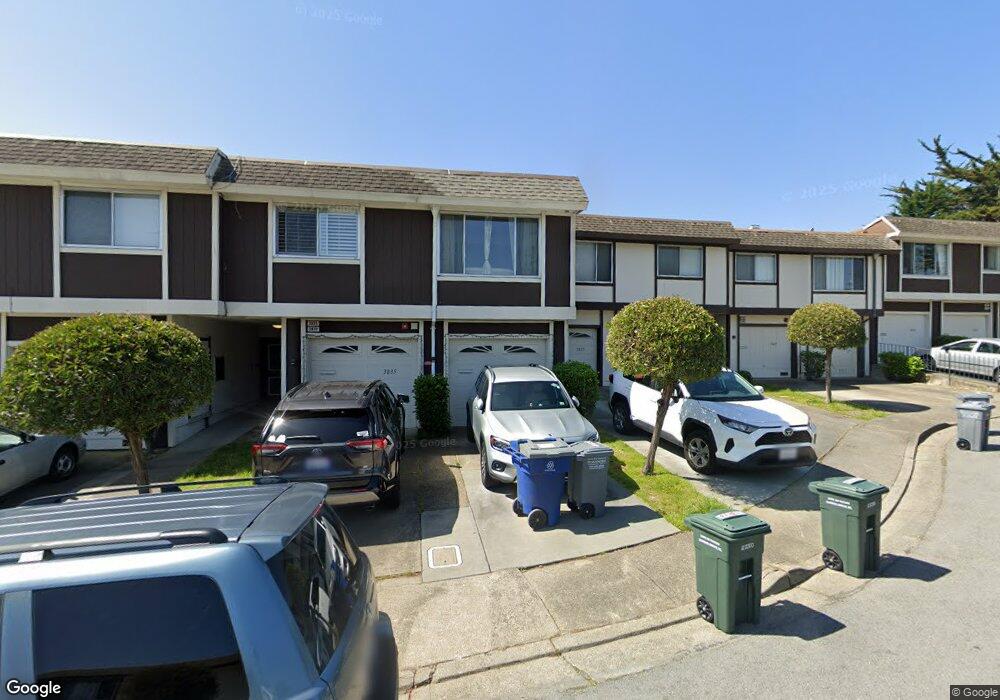
3835 Annapolis Ct Unit 17B South San Francisco, CA 94080
Westborough NeighborhoodEstimated Value: $668,875 - $789,000
2
Beds
1
Bath
858
Sq Ft
$870/Sq Ft
Est. Value
About This Home
This home is located at 3835 Annapolis Ct Unit 17B, South San Francisco, CA 94080 and is currently estimated at $746,469, approximately $870 per square foot. 3835 Annapolis Ct Unit 17B is a home located in San Mateo County with nearby schools including Skyline Elementary School, Westborough Middle School, and South San Francisco High School.
Ownership History
Date
Name
Owned For
Owner Type
Purchase Details
Closed on
Mar 17, 2006
Sold by
Dohi Kenji and Meier Ellen
Bought by
Buitre Santiago Alfredo Cruz and Buitre Santiago Rosie
Current Estimated Value
Home Financials for this Owner
Home Financials are based on the most recent Mortgage that was taken out on this home.
Original Mortgage
$400,000
Outstanding Balance
$227,131
Interest Rate
6.25%
Mortgage Type
Purchase Money Mortgage
Estimated Equity
$519,338
Purchase Details
Closed on
Feb 5, 2004
Sold by
Grant Hunter
Bought by
Dohi Kenji and Meier Ellen
Home Financials for this Owner
Home Financials are based on the most recent Mortgage that was taken out on this home.
Original Mortgage
$294,400
Interest Rate
5.82%
Mortgage Type
Purchase Money Mortgage
Purchase Details
Closed on
Nov 28, 2000
Sold by
Pena George J & Mable Wong Trs
Bought by
Grant Hunter
Purchase Details
Closed on
Sep 11, 1996
Sold by
Pena George J and Pena Mable W
Bought by
Wong Pena George J and Wong Pena Mable
Create a Home Valuation Report for This Property
The Home Valuation Report is an in-depth analysis detailing your home's value as well as a comparison with similar homes in the area
Home Values in the Area
Average Home Value in this Area
Purchase History
| Date | Buyer | Sale Price | Title Company |
|---|---|---|---|
| Buitre Santiago Alfredo Cruz | $500,000 | Old Republic Title Company | |
| Dohi Kenji | $368,000 | First American Title Company | |
| Grant Hunter | $279,000 | Commonwealth Land Title Ins | |
| Wong Pena George J | -- | -- |
Source: Public Records
Mortgage History
| Date | Status | Borrower | Loan Amount |
|---|---|---|---|
| Open | Buitre Santiago Alfredo Cruz | $400,000 | |
| Previous Owner | Dohi Kenji | $294,400 | |
| Closed | Dohi Kenji | $55,200 |
Source: Public Records
Tax History Compared to Growth
Tax History
| Year | Tax Paid | Tax Assessment Tax Assessment Total Assessment is a certain percentage of the fair market value that is determined by local assessors to be the total taxable value of land and additions on the property. | Land | Improvement |
|---|---|---|---|---|
| 2025 | $7,701 | $683,274 | $204,978 | $478,296 |
| 2023 | $7,701 | $656,743 | $197,019 | $459,724 |
| 2022 | $7,337 | $643,866 | $193,156 | $450,710 |
| 2021 | $7,342 | $631,242 | $189,369 | $441,873 |
| 2020 | $7,178 | $624,771 | $187,428 | $437,343 |
| 2019 | $7,159 | $612,521 | $183,753 | $428,768 |
| 2018 | $6,942 | $600,511 | $180,150 | $420,361 |
| 2017 | $6,606 | $588,737 | $176,618 | $412,119 |
| 2016 | $6,553 | $577,194 | $173,155 | $404,039 |
| 2015 | $5,006 | $435,000 | $130,000 | $305,000 |
| 2014 | $4,804 | $415,000 | $124,000 | $291,000 |
Source: Public Records
Map
Nearby Homes
- 2210 Gellert Blvd Unit 5111
- 2449 Unwin Ct
- 19 Escanyo Dr
- 124 Berenda Dr
- 2410 Bantry Ln
- 556 Keoncrest Dr
- 1 Appian Way Unit 715-11
- 1 Appian Way Unit 703-2
- 109 Lycett Cir
- 2504 Ardee Ln
- 289 Barbara Ln
- 286 Barbara Ln
- 706 Serra Dr
- 2575 Bantry Ln
- 2679 Sean Ct
- 227 Wicklow Dr
- 2779 Duhallow Way
- 3855 Carter Dr Unit 101
- 3885 Carter Dr Unit 307
- 3550 Carter Dr Unit 30
- 3833 Annapolis Ct Unit 17A
- 3839 Annapolis Ct Unit 16B
- 3843 Annapolis Ct
- 3841 Annapolis Ct
- 3829 Annapolis Ct
- 3847 Annapolis Ct
- 3851 Annapolis Ct
- 3849 Annapolis Ct
- 3831 Annapolis Ct Unit 18B
- 3837 Annapolis Ct
- 3845 Annapolis Ct
- 2460 Rowntree Way
- 2456 Rowntree Way
- 2454 Rowntree Way
- 2448 Rowntree Way
- 2444 Rowntree Way Unit 22A
- 2434 Rowntree Way Unit 19B
- 3856 Radburn Dr
- 3858 Radburn Dr
- 3844 Radburn Dr