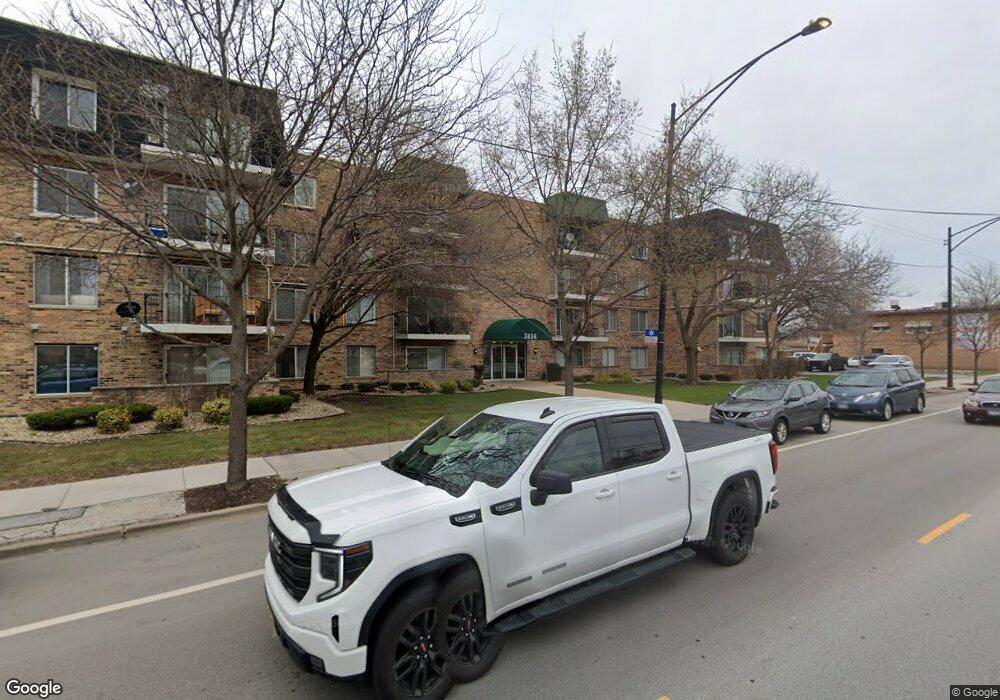
3838 W 111th St Unit 205 Chicago, IL 60655
Mount Greenwood NeighborhoodEstimated Value: $139,000 - $217,000
2
Beds
1
Bath
--
Sq Ft
0.84
Acres
About This Home
This home is located at 3838 W 111th St Unit 205, Chicago, IL 60655 and is currently estimated at $168,578. 3838 W 111th St Unit 205 is a home located in Cook County with nearby schools including Mount Greenwood Elementary School, Morgan Park High School, and St. Christina School.
Ownership History
Date
Name
Owned For
Owner Type
Purchase Details
Closed on
Nov 29, 2004
Sold by
Mertes David J
Bought by
Woods Brian E
Current Estimated Value
Home Financials for this Owner
Home Financials are based on the most recent Mortgage that was taken out on this home.
Original Mortgage
$101,200
Outstanding Balance
$48,611
Interest Rate
5.12%
Mortgage Type
New Conventional
Estimated Equity
$119,967
Purchase Details
Closed on
Oct 17, 2001
Sold by
Luchesi Robert P
Bought by
Mertes David J
Home Financials for this Owner
Home Financials are based on the most recent Mortgage that was taken out on this home.
Original Mortgage
$73,237
Interest Rate
7.07%
Mortgage Type
FHA
Purchase Details
Closed on
Nov 25, 1998
Sold by
Burton Passive Income V Ltd Partnership
Bought by
Luchesi Robert P
Home Financials for this Owner
Home Financials are based on the most recent Mortgage that was taken out on this home.
Original Mortgage
$71,900
Interest Rate
7.17%
Create a Home Valuation Report for This Property
The Home Valuation Report is an in-depth analysis detailing your home's value as well as a comparison with similar homes in the area
Home Values in the Area
Average Home Value in this Area
Purchase History
| Date | Buyer | Sale Price | Title Company |
|---|---|---|---|
| Woods Brian E | $126,500 | Multiple | |
| Mertes David J | $75,000 | -- | |
| Luchesi Robert P | $72,000 | Professional National Title |
Source: Public Records
Mortgage History
| Date | Status | Borrower | Loan Amount |
|---|---|---|---|
| Open | Woods Brian E | $101,200 | |
| Previous Owner | Mertes David J | $73,237 | |
| Previous Owner | Luchesi Robert P | $71,900 | |
| Closed | Woods Brian E | $25,300 |
Source: Public Records
Tax History Compared to Growth
Tax History
| Year | Tax Paid | Tax Assessment Tax Assessment Total Assessment is a certain percentage of the fair market value that is determined by local assessors to be the total taxable value of land and additions on the property. | Land | Improvement |
|---|---|---|---|---|
| 2024 | $1,630 | $12,919 | $1,244 | $11,675 |
| 2023 | $1,863 | $11,021 | $1,321 | $9,700 |
| 2022 | $1,863 | $12,453 | $1,321 | $11,132 |
| 2021 | $1,840 | $12,452 | $1,321 | $11,131 |
| 2020 | $213 | $4,055 | $945 | $3,110 |
| 2019 | $203 | $4,435 | $945 | $3,490 |
| 2018 | $198 | $4,435 | $945 | $3,490 |
| 2017 | $622 | $6,260 | $846 | $5,414 |
| 2016 | $755 | $6,260 | $846 | $5,414 |
| 2015 | $668 | $6,260 | $846 | $5,414 |
| 2014 | $1,521 | $10,746 | $796 | $9,950 |
| 2013 | $1,480 | $10,746 | $796 | $9,950 |
Source: Public Records
Map
Nearby Homes
- 3836 W 110th Place
- 3835 W 109th Place
- 3812 W 109th Place
- 10828 S Pulaski Rd
- 3857 W 107th Place
- 10728 S Pulaski Rd
- 3818 W 107th St
- 10823 S Keeler Ave
- 4000 W 107th St
- 10606 S Ridgeway Ave
- 10950 S Homan Ave
- 3712 W 115th St
- 4325 Adeline Dr
- 3836 W 115th Place
- 10528 S Lawndale Ave
- 4328 W 109th St
- 10511 S Hamlin Ave
- 11160 S Christiana Ave
- 4343 W 109th St
- 3428 W 107th St
- 3838 W 111th St Unit 108
- 3838 W 111th St Unit 408
- 3838 W 111th St Unit 311
- 3838 W 111th St Unit 401
- 3838 W 111th St Unit 307
- 3838 W 111th St Unit 206
- 3838 W 111th St Unit 304
- 3838 W 111th St Unit 303
- 3838 W 111th St Unit 301
- 3838 W 111th St Unit 201
- 3838 W 111th St Unit 202
- 3838 W 111th St Unit 210
- 3838 W 111th St Unit 411
- 3838 W 111th St Unit 405
- 3838 W 111th St Unit 305
- 3838 W 111th St Unit 208
- 3838 W 111th St Unit 209
- 3838 W 111th St Unit 410
- 3838 W 111th St Unit 408
- 3838 W 111th St Unit 204