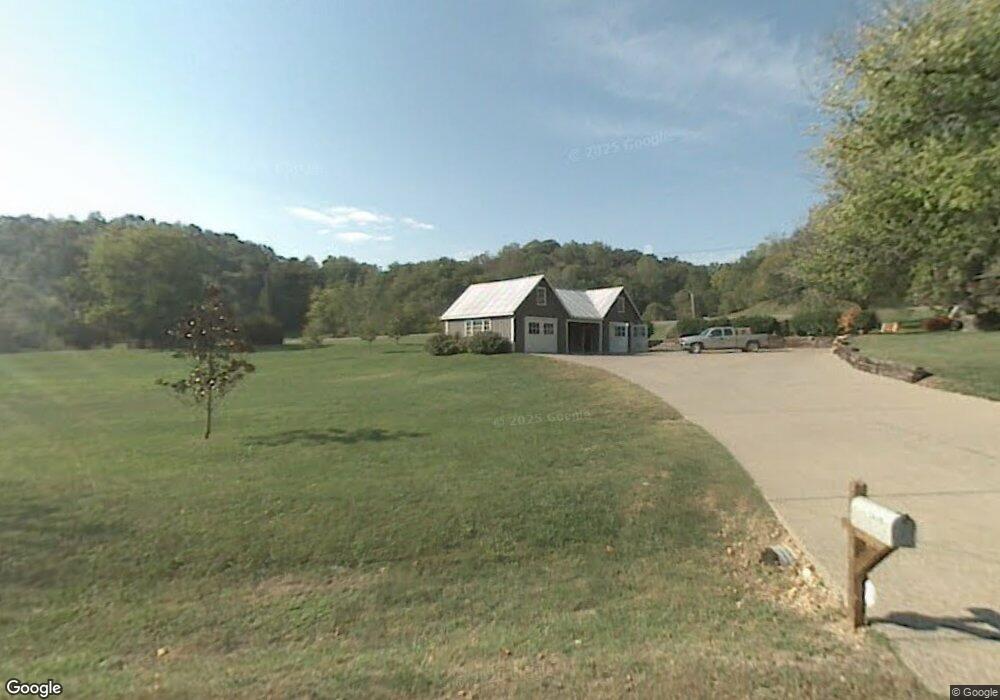
3839 Old Charlotte Pike Franklin, TN 37069
Estimated Value: $786,000 - $1,127,000
--
Bed
2
Baths
1,856
Sq Ft
$520/Sq Ft
Est. Value
About This Home
This home is located at 3839 Old Charlotte Pike, Franklin, TN 37069 and is currently estimated at $964,742, approximately $519 per square foot. 3839 Old Charlotte Pike is a home located in Williamson County with nearby schools including Walnut Grove Elementary School, Grassland Middle School, and Franklin High School.
Ownership History
Date
Name
Owned For
Owner Type
Purchase Details
Closed on
Apr 5, 2005
Sold by
Edmondson Gus S and Edmondson Rachel
Bought by
Roberts Kenneth J and Kenneth J Roberts Revocable Tr
Current Estimated Value
Purchase Details
Closed on
Sep 20, 2001
Sold by
Edmondson Gus Sanders and Buchanan Rachel Nicole
Bought by
Edmondson T Larry
Home Financials for this Owner
Home Financials are based on the most recent Mortgage that was taken out on this home.
Original Mortgage
$148,000
Interest Rate
6.89%
Mortgage Type
Purchase Money Mortgage
Purchase Details
Closed on
Feb 24, 2000
Sold by
Roberts Randall David and Roberts Brenda C
Bought by
Edmondson Gus Sanders and Buchanan Rachel Nicole
Home Financials for this Owner
Home Financials are based on the most recent Mortgage that was taken out on this home.
Original Mortgage
$135,000
Interest Rate
8.21%
Purchase Details
Closed on
Sep 3, 1996
Sold by
Roberts Randall David
Bought by
Roberts Randall David
Create a Home Valuation Report for This Property
The Home Valuation Report is an in-depth analysis detailing your home's value as well as a comparison with similar homes in the area
Home Values in the Area
Average Home Value in this Area
Purchase History
| Date | Buyer | Sale Price | Title Company |
|---|---|---|---|
| Roberts Kenneth J | $329,000 | Old Republic National Title | |
| Edmondson T Larry | -- | Attorneys Title Company Inc | |
| Edmondson Gus Sanders | $160,000 | -- | |
| Roberts Randall David | -- | -- |
Source: Public Records
Mortgage History
| Date | Status | Borrower | Loan Amount |
|---|---|---|---|
| Previous Owner | Edmondson T Larry | $148,000 | |
| Previous Owner | Edmondson Gus Sanders | $135,000 |
Source: Public Records
Tax History Compared to Growth
Tax History
| Year | Tax Paid | Tax Assessment Tax Assessment Total Assessment is a certain percentage of the fair market value that is determined by local assessors to be the total taxable value of land and additions on the property. | Land | Improvement |
|---|---|---|---|---|
| 2024 | -- | $118,375 | $61,200 | $57,175 |
| 2023 | $2,225 | $118,375 | $61,200 | $57,175 |
| 2022 | $2,225 | $118,375 | $61,200 | $57,175 |
| 2021 | $2,225 | $118,375 | $61,200 | $57,175 |
| 2020 | $1,975 | $88,950 | $34,000 | $54,950 |
| 2019 | $1,975 | $88,950 | $34,000 | $54,950 |
| 2018 | $1,912 | $88,950 | $34,000 | $54,950 |
| 2017 | $1,912 | $88,950 | $34,000 | $54,950 |
| 2016 | $1,912 | $88,950 | $34,000 | $54,950 |
| 2015 | -- | $71,925 | $26,150 | $45,775 |
| 2014 | -- | $71,925 | $26,150 | $45,775 |
Source: Public Records
Map
Nearby Homes
- 3730 Old Charlotte Pike
- 782 High Point Ridge Rd
- 791 High Point Ridge Rd
- 3945 New Highway 96 W
- 824 High Point Ridge Rd
- 0 Old Hwy 96 W Unit RTC2998655
- 1020 Legacy Hills Dr
- 2017 Vista Creek Ln
- 2200 Candler Grove Ct
- 2108 Barrel Creek Trail
- 1702 Old Hillsboro Rd
- 2000 Vista Creek Ln
- 1757 Old Hillsboro Rd
- 1060 Natchez Valley Ln
- 1120 Natchez Valley Ln
- 1075 Natchez Valley Ln
- 2014 Old Hillsboro Rd
- 1T Old Hillsboro Rd
- 2T Old Hillsboro Rd
- 1520 Natchez Rd
- 3833 New Highway 96 W
- 3842 New Highway 96 W
- 3824 New Highway 96 W
- 3815 New Highway 96 W
- 3826 Old Charlotte Pike
- 5111 Waddell Hollow Rd
- 3854 New Highway 96 W
- 5137 Waddell Hollow Rd
- 3817 Old Charlotte Pike
- 3700 Pishon Trail
- 5100 Waddell Hollow Rd
- 3812 New Highway 96 W
- 5121 Waddell Hollow Rd
- 3816 Old Charlotte Pike
- 1107 Deer Lake Rd
- 3706 Pishon Trail
- 3701 Pishon Trail
- 3810 New Highway 96 W
- 1111 Deer Lake Rd
- 3705 Pishon Trail