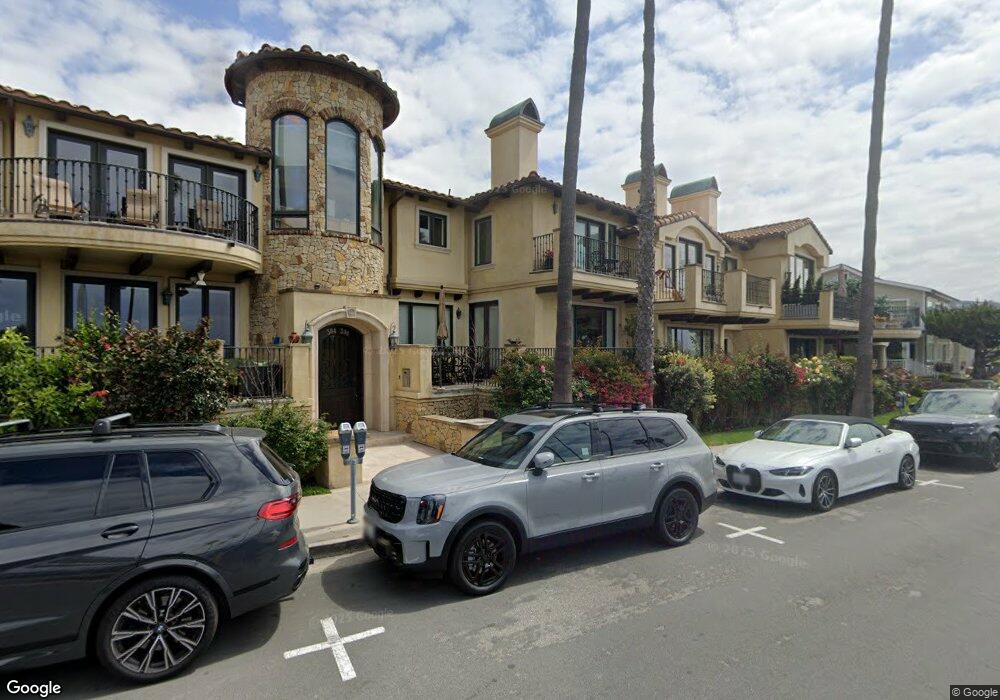
384 Cliff Dr Laguna Beach, CA 92651
North Laguna NeighborhoodEstimated Value: $1,833,000 - $3,318,490
3
Beds
4
Baths
2,336
Sq Ft
$1,143/Sq Ft
Est. Value
About This Home
This home is located at 384 Cliff Dr, Laguna Beach, CA 92651 and is currently estimated at $2,669,123, approximately $1,142 per square foot. 384 Cliff Dr is a home located in Orange County with nearby schools including El Morro Elementary School, Thurston Middle School, and Laguna Beach High School.
Ownership History
Date
Name
Owned For
Owner Type
Purchase Details
Closed on
Dec 13, 2012
Sold by
The Richard J Secchiaroli Nevada 1993 Tr
Bought by
384 Cliff Drive Llc
Current Estimated Value
Purchase Details
Closed on
Oct 25, 2000
Sold by
Secchiaroli Kathleen
Bought by
Secchiaroli Michael
Home Financials for this Owner
Home Financials are based on the most recent Mortgage that was taken out on this home.
Original Mortgage
$368,750
Interest Rate
7.86%
Mortgage Type
Stand Alone First
Purchase Details
Closed on
Oct 6, 2000
Sold by
Cupisz Anthony
Bought by
Secchiaroli Michael
Home Financials for this Owner
Home Financials are based on the most recent Mortgage that was taken out on this home.
Original Mortgage
$368,750
Interest Rate
7.86%
Mortgage Type
Stand Alone First
Purchase Details
Closed on
Aug 20, 1998
Sold by
Secchiaroli Richard J
Bought by
Cupisz Anthony
Create a Home Valuation Report for This Property
The Home Valuation Report is an in-depth analysis detailing your home's value as well as a comparison with similar homes in the area
Home Values in the Area
Average Home Value in this Area
Purchase History
| Date | Buyer | Sale Price | Title Company |
|---|---|---|---|
| 384 Cliff Drive Llc | $2,000,000 | Ticor Title Co Of California | |
| Secchiaroli Michael | -- | Chicago Title Co | |
| Secchiaroli Michael | $695,000 | Chicago Title Co | |
| Cupisz Anthony | -- | Chicago Title Co |
Source: Public Records
Mortgage History
| Date | Status | Borrower | Loan Amount |
|---|---|---|---|
| Previous Owner | Secchiaroli Michael | $368,750 |
Source: Public Records
Tax History Compared to Growth
Tax History
| Year | Tax Paid | Tax Assessment Tax Assessment Total Assessment is a certain percentage of the fair market value that is determined by local assessors to be the total taxable value of land and additions on the property. | Land | Improvement |
|---|---|---|---|---|
| 2025 | $25,493 | $2,462,853 | $2,028,705 | $434,148 |
| 2024 | $25,493 | $2,414,562 | $1,988,926 | $425,636 |
| 2023 | $24,877 | $2,367,218 | $1,949,927 | $417,291 |
| 2022 | $24,377 | $2,320,802 | $1,911,693 | $409,109 |
| 2021 | $23,878 | $2,275,297 | $1,874,209 | $401,088 |
| 2020 | $23,595 | $2,251,967 | $1,854,991 | $396,976 |
| 2019 | $23,168 | $2,207,811 | $1,818,618 | $389,193 |
| 2018 | $22,704 | $2,164,521 | $1,782,959 | $381,562 |
| 2017 | $22,241 | $2,122,080 | $1,747,999 | $374,081 |
| 2016 | $21,806 | $2,080,471 | $1,713,724 | $366,747 |
| 2015 | $21,465 | $2,049,221 | $1,687,982 | $361,239 |
| 2014 | $21,042 | $2,009,080 | $1,654,917 | $354,163 |
Source: Public Records
Map
Nearby Homes
- 392 Cliff Dr
- 386 Cliff Dr
- 388 Cliff Dr
- 390 Cliff Dr
- 396 Cliff Dr
- 397 N Coast Hwy
- 376 Cliff Dr Unit K
- 376 Cliff Dr Unit G
- 376 Cliff Dr
- 376 Cliff Dr Unit F
- 376 Cliff Dr Unit E
- 376 Cliff Dr Unit C
- 376 Cliff Dr Unit B
- 376 Cliff Dr Unit A
- 376 Cliff Dr Unit D
- 3 Jasmine St Unit 3
- 187 Jasmine St
- 364 Cliff Dr Unit B
- 364 Cliff Dr Unit 3
- 364 Cliff Dr Unit A