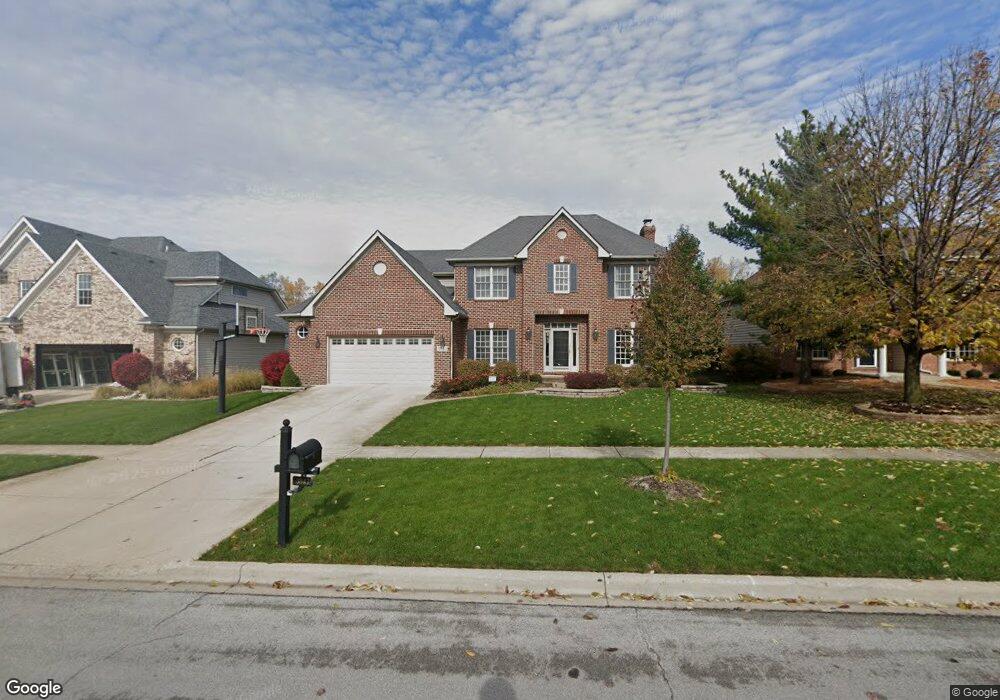
3843 Grassmere Rd Unit 1 Naperville, IL 60564
Tall Grass NeighborhoodEstimated Value: $697,570 - $792,000
Studio
1
Bath
2,546
Sq Ft
$298/Sq Ft
Est. Value
About This Home
This home is located at 3843 Grassmere Rd Unit 1, Naperville, IL 60564 and is currently estimated at $758,143, approximately $297 per square foot. 3843 Grassmere Rd Unit 1 is a home located in Will County with nearby schools including Fry Elementary School, Scullen Middle School, and Waubonsie Valley High School.
Ownership History
Date
Name
Owned For
Owner Type
Purchase Details
Closed on
Aug 3, 2010
Sold by
Kelly Thomas F and Kelly Nadia R
Bought by
Kelly Thomas F and Kelly Nadia R
Current Estimated Value
Purchase Details
Closed on
Jul 25, 2002
Sold by
Foust Donald R and Foust Lori N
Bought by
Kelly Thomas F and Suriwka Nadia R
Home Financials for this Owner
Home Financials are based on the most recent Mortgage that was taken out on this home.
Original Mortgage
$332,000
Outstanding Balance
$141,639
Interest Rate
6.8%
Estimated Equity
$616,504
Purchase Details
Closed on
Jan 24, 2000
Sold by
Fessler Inc
Bought by
Foust Donald R and Foust Lori N
Home Financials for this Owner
Home Financials are based on the most recent Mortgage that was taken out on this home.
Original Mortgage
$215,500
Interest Rate
7.37%
Create a Home Valuation Report for This Property
The Home Valuation Report is an in-depth analysis detailing your home's value as well as a comparison with similar homes in the area
Home Values in the Area
Average Home Value in this Area
Purchase History
We collect this data history from publicly available records. To have your information removed, we recommend requesting removal directly through your county’s website.
| Date | Buyer | Sale Price | Title Company |
|---|---|---|---|
| Kelly Thomas F | -- | None Available | |
| Kelly Thomas F | -- | None Available | |
| Kelly Thomas F | $415,000 | First American Title | |
| Foust Donald R | $355,500 | Chicago Title Insurance Co |
Source: Public Records
Mortgage History
We collect this data history from publicly available records. To have your information removed, we recommend requesting removal directly through your county’s website.
| Date | Status | Borrower | Loan Amount |
|---|---|---|---|
| Open | Kelly Thomas F | $332,000 | |
| Previous Owner | Foust Donald R | $215,500 | |
| Closed | Kelly Thomas F | $41,500 |
Source: Public Records
Tax History
| Year | Tax Paid | Tax Assessment Tax Assessment Total Assessment is a certain percentage of the fair market value that is determined by local assessors to be the total taxable value of land and additions on the property. | Land | Improvement |
|---|---|---|---|---|
| 2024 | $13,863 | $209,507 | $66,332 | $143,175 |
| 2023 | $13,199 | $185,077 | $58,597 | $126,480 |
| 2022 | $12,261 | $175,229 | $55,432 | $119,797 |
| 2021 | $11,719 | $166,884 | $52,792 | $114,092 |
| 2020 | $11,496 | $164,240 | $51,956 | $112,284 |
| 2019 | $11,299 | $159,612 | $50,492 | $109,120 |
| 2018 | $10,613 | $147,675 | $49,381 | $98,294 |
| 2017 | $10,450 | $143,862 | $48,106 | $95,756 |
| 2016 | $10,430 | $140,765 | $47,070 | $93,695 |
| 2015 | $10,916 | $135,351 | $45,260 | $90,091 |
| 2014 | $10,916 | $138,707 | $45,270 | $93,437 |
| 2013 | $10,916 | $138,707 | $45,270 | $93,437 |
Source: Public Records
Map
Nearby Homes
- 3744 Highknob Cir
- 3332 Farmgate Dr
- 2852 Normandy Cir
- 3707 Idlewild Ln
- 2815 Normandy Cir
- 2832 Chevy Chase Ln
- 3415 Minito Ct
- 2967 Madison Dr
- 3807 Landsdown Ave
- 4071 Chesapeake Ln
- 4055 Chesapeake Ln
- 4255 Fraser Cir
- 3424 Parliament Ln
- 2925 Madison Dr
- 4319 Silver Bell Ct
- 2615 Cranbrook St
- 2629 Camberley Cir
- 4456 Monroe Ct
- 2630 Camberley Cir
- 4323 Fraser Cir
- 3823 Sunburst Ln
- 3819 Sunburst Ln Unit 1
- 3827 Sunburst Ln
- 3840 Grassmere Rd
- 3836 Grassmere Rd
- 3815 Sunburst Ln
- 3844 Grassmere Rd
- 3824 Sunburst Ln
- 3832 Grassmere Rd
- 3820 Sunburst Ln
- 3828 Sunburst Ln Unit 1
- 3811 Sunburst Ln
- 3816 Sunburst Ln
- 3832 Sunburst Ln
- 3828 Grassmere Rd
- 3840 Sunburst Ln
- 3844 Sunburst Ln
- 3836 Sunburst Ln
- 3848 Sunburst Ln
- 3807 Sunburst Ln
Your Personal Tour Guide
Ask me questions while you tour the home.