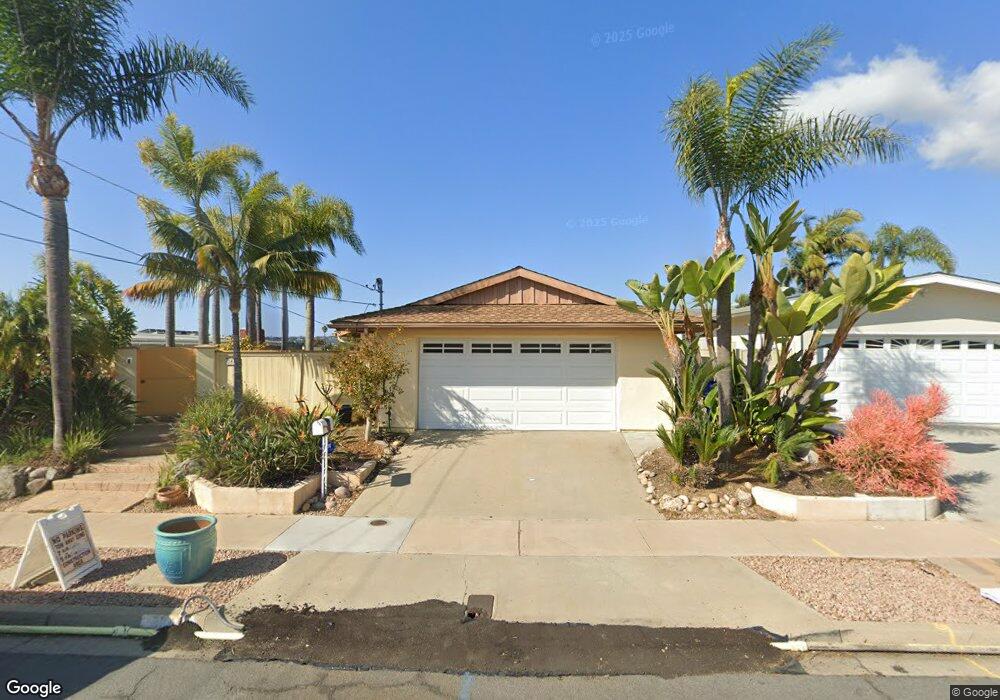
3844 Carson St San Diego, CA 92117
Bay Ho NeighborhoodEstimated Value: $1,360,000 - $1,669,000
3
Beds
2
Baths
1,560
Sq Ft
$956/Sq Ft
Est. Value
About This Home
This home is located at 3844 Carson St, San Diego, CA 92117 and is currently estimated at $1,490,745, approximately $955 per square foot. 3844 Carson St is a home located in San Diego County with nearby schools including Cadman Elementary School, Marston Middle School, and Clairemont High School.
Ownership History
Date
Name
Owned For
Owner Type
Purchase Details
Closed on
Sep 13, 2012
Sold by
Kaiser Susan M
Bought by
Weaver Robert P and Weaver Leslie E
Current Estimated Value
Home Financials for this Owner
Home Financials are based on the most recent Mortgage that was taken out on this home.
Original Mortgage
$400,000
Outstanding Balance
$276,130
Interest Rate
3.52%
Mortgage Type
New Conventional
Estimated Equity
$1,214,615
Purchase Details
Closed on
Jan 30, 2006
Sold by
Santley J Sterling J and Santley Cecilia
Bought by
Kaiser Susan M
Home Financials for this Owner
Home Financials are based on the most recent Mortgage that was taken out on this home.
Original Mortgage
$591,992
Interest Rate
6%
Mortgage Type
Purchase Money Mortgage
Purchase Details
Closed on
Jul 12, 1996
Sold by
Reese Richard V and Reese Marion P
Bought by
Santley J Sterling J and Santley Cecilia
Home Financials for this Owner
Home Financials are based on the most recent Mortgage that was taken out on this home.
Original Mortgage
$160,000
Interest Rate
8.33%
Create a Home Valuation Report for This Property
The Home Valuation Report is an in-depth analysis detailing your home's value as well as a comparison with similar homes in the area
Home Values in the Area
Average Home Value in this Area
Purchase History
| Date | Buyer | Sale Price | Title Company |
|---|---|---|---|
| Weaver Robert P | $631,000 | California Title Company | |
| Kaiser Susan M | $740,000 | Stewart Title Company | |
| Santley J Sterling J | $200,000 | Commonwealth Land Title Co |
Source: Public Records
Mortgage History
| Date | Status | Borrower | Loan Amount |
|---|---|---|---|
| Open | Weaver Robert P | $400,000 | |
| Previous Owner | Kaiser Susan M | $591,992 | |
| Previous Owner | Santley J Sterling J | $160,000 |
Source: Public Records
Tax History
| Year | Tax Paid | Tax Assessment Tax Assessment Total Assessment is a certain percentage of the fair market value that is determined by local assessors to be the total taxable value of land and additions on the property. | Land | Improvement |
|---|---|---|---|---|
| 2025 | $9,304 | $777,019 | $529,508 | $247,511 |
| 2024 | $9,304 | $761,784 | $519,126 | $242,658 |
| 2023 | $9,097 | $746,848 | $508,948 | $237,900 |
| 2022 | $8,854 | $732,205 | $498,969 | $233,236 |
| 2021 | $8,792 | $717,849 | $489,186 | $228,663 |
| 2020 | $8,685 | $710,489 | $484,170 | $226,319 |
| 2019 | $8,528 | $696,559 | $474,677 | $221,882 |
| 2018 | $8,054 | $682,902 | $465,370 | $217,532 |
| 2017 | $80 | $669,513 | $456,246 | $213,267 |
| 2016 | $7,738 | $656,386 | $447,300 | $209,086 |
| 2015 | $7,624 | $646,528 | $440,582 | $205,946 |
| 2014 | $7,504 | $633,864 | $431,952 | $201,912 |
Source: Public Records
Map
Nearby Homes
- 3539 Mount Laurence Dr
- 3692 Princeton Ave
- 0 Trenton Ave Unit PTP2506622
- 0 Trenton Ave Unit PTP2506624
- 0 Trenton Ave Unit PTP2506625
- 0 Trenton Ave Unit PTP2506626
- 0 Trenton Ave Unit PTP2506629
- 0 Trenton Ave Unit PTP2506627
- 3546 Trenton Ave
- 0 Trenton Ave Unit PTP2508162
- 3861 Hiawatha Way
- 3602 Ticonderoga St
- 4210 Moraga Ave
- 3910 Hiawatha Way
- 3727 Ticonderoga St
- 4701 Misty Place
- 4557 Misty Place
- 4840 Canyon View
- 4517 Misty Place
- 4924 4930 Iroquois Ave
Your Personal Tour Guide
Ask me questions while you tour the home.