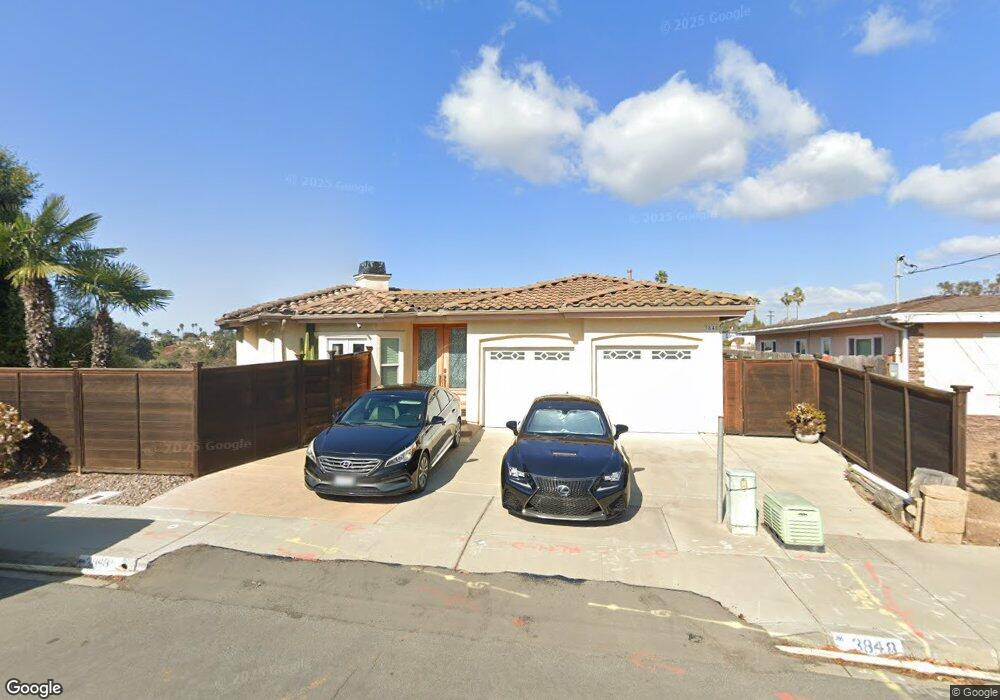
3848 Chippewa Ct San Diego, CA 92117
Bay Ho NeighborhoodEstimated Value: $1,541,000 - $1,865,967
4
Beds
4
Baths
2,405
Sq Ft
$702/Sq Ft
Est. Value
About This Home
This home is located at 3848 Chippewa Ct, San Diego, CA 92117 and is currently estimated at $1,687,742, approximately $701 per square foot. 3848 Chippewa Ct is a home located in San Diego County with nearby schools including Cadman Elementary School, Marston Middle School, and Clairemont High School.
Ownership History
Date
Name
Owned For
Owner Type
Purchase Details
Closed on
Oct 21, 2005
Sold by
Kelley Michael C and Kelley Linda L
Bought by
Thomas Raymond V and Thomas Linda L
Current Estimated Value
Purchase Details
Closed on
Feb 22, 2002
Sold by
Bay View Development Company Llc
Bought by
Kelley Michael C and Kelley Linda L
Purchase Details
Closed on
Sep 3, 1997
Sold by
Bay Ridge Scene Associates
Bought by
Bay View Development Company Llc
Home Financials for this Owner
Home Financials are based on the most recent Mortgage that was taken out on this home.
Original Mortgage
$1,011,233
Interest Rate
7.54%
Mortgage Type
Construction
Purchase Details
Closed on
May 6, 1996
Sold by
Asset Builders Inc
Bought by
Longwell Bill J and Longwell Kathleen
Purchase Details
Closed on
Jan 27, 1989
Sold by
Rakov Nathan and Booth Robert
Bought by
Bay Ridge Scene Associates
Create a Home Valuation Report for This Property
The Home Valuation Report is an in-depth analysis detailing your home's value as well as a comparison with similar homes in the area
Home Values in the Area
Average Home Value in this Area
Purchase History
| Date | Buyer | Sale Price | Title Company |
|---|---|---|---|
| Thomas Raymond V | $769,000 | Chicago Title Co | |
| Kelley Michael C | $147,500 | Commonwealth Land Title Co | |
| Bay View Development Company Llc | -- | Commonwealth Land Title Co | |
| Longwell Bill J | -- | Stewart Title Company | |
| Rakov Nathan | -- | Stewart Title Company | |
| Booth Robert | -- | Stewart Title Company | |
| Persichino Gary A | -- | Stewart Title Company | |
| Bay Ridge Scene Associates | -- | Stewart Title |
Source: Public Records
Mortgage History
| Date | Status | Borrower | Loan Amount |
|---|---|---|---|
| Previous Owner | Bay View Development Company Llc | $1,011,233 |
Source: Public Records
Tax History Compared to Growth
Tax History
| Year | Tax Paid | Tax Assessment Tax Assessment Total Assessment is a certain percentage of the fair market value that is determined by local assessors to be the total taxable value of land and additions on the property. | Land | Improvement |
|---|---|---|---|---|
| 2025 | $12,601 | $1,050,874 | $373,369 | $677,505 |
| 2024 | $12,601 | $1,030,270 | $366,049 | $664,221 |
| 2023 | $12,322 | $1,010,070 | $358,872 | $651,198 |
| 2022 | $11,993 | $990,266 | $351,836 | $638,430 |
| 2021 | $11,909 | $970,850 | $344,938 | $625,912 |
| 2020 | $11,764 | $960,897 | $341,402 | $619,495 |
| 2019 | $11,553 | $942,057 | $334,708 | $607,349 |
| 2018 | $10,799 | $923,587 | $328,146 | $595,441 |
| 2017 | $80 | $905,478 | $321,712 | $583,766 |
| 2016 | $10,372 | $887,724 | $315,404 | $572,320 |
| 2015 | $10,218 | $874,391 | $310,667 | $563,724 |
| 2014 | $7,965 | $680,000 | $240,000 | $440,000 |
Source: Public Records
Map
Nearby Homes
- 3719 Balboa Terrace Unit A
- 4150 Taos Dr
- 3341 Cadden Dr
- 3903 Cadden Way
- 3652 Clairemont Dr Unit 1B
- 3539 Mount Laurence Dr
- 3294 Atari Ct
- 4410 Gila Ave
- 3360 Mount Laurence Dr
- 3212 Cadden Ct
- 4695 Mount Armet Dr
- 4203 Tolowa St
- 4226 Mount Voss Dr
- 0 Trenton Ave Unit PTP2506622
- 0 Trenton Ave Unit PTP2506624
- 0 Trenton Ave Unit PTP2506625
- 0 Trenton Ave Unit PTP2506626
- 0 Trenton Ave Unit PTP2506629
- 0 Trenton Ave Unit PTP2506627
- 3546 Trenton Ave
- 3850 Chippewa Ct
- 3836 Chippewa Ct
- 3860 Chippewa Ct
- 3870 Chippewa Ct
- 3849 Chippewa Ct
- 3833 Chippewa Ct
- 3851 Chippewa Ct
- 3824 Chippewa Ct
- 3824 Chippewa Ct Unit 5
- 3861 Chippewa Ct
- 4028 Gros Ventre Ave
- 3880 Chippewa Ct
- 4022 Gros Ventre Ave
- 4016 Gros Ventre Ave
- 3816 Chippewa Ct
- 4008 Gros Ventre Ave
- 3871 Chippewa Ct
- 3814 Boone St
- 3826 Boone St
- 3838 Boone St