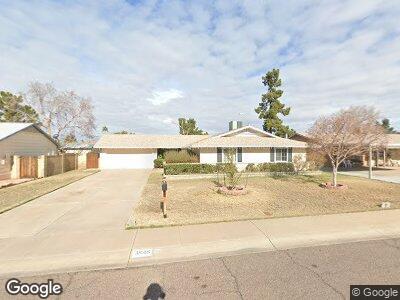
3848 W Cochise Dr Phoenix, AZ 85051
North Mountain Village NeighborhoodEstimated Value: $326,875 - $429,000
4
Beds
2
Baths
1,938
Sq Ft
$202/Sq Ft
Est. Value
About This Home
This home is located at 3848 W Cochise Dr, Phoenix, AZ 85051 and is currently estimated at $392,219, approximately $202 per square foot. 3848 W Cochise Dr is a home located in Maricopa County with nearby schools including Tumbleweed Elementary School, Cholla Middle School, and Cortez High School.
Ownership History
Date
Name
Owned For
Owner Type
Purchase Details
Closed on
Jul 8, 2014
Sold by
Stewart Jay A and Stewart Amanda E
Bought by
Jay & Amanda Stewart Living Trust
Current Estimated Value
Purchase Details
Closed on
Dec 11, 2003
Sold by
Jenkins Jeffrey and Jenkins Hollie
Bought by
Stewart Jay A and Stewart Amanda E
Home Financials for this Owner
Home Financials are based on the most recent Mortgage that was taken out on this home.
Original Mortgage
$35,000
Outstanding Balance
$17,095
Interest Rate
5.88%
Mortgage Type
New Conventional
Estimated Equity
$373,951
Purchase Details
Closed on
Nov 12, 1997
Sold by
Davis Carl R and Davis Frances Colleen
Bought by
Jenkins Jeffrey and West Hollie
Home Financials for this Owner
Home Financials are based on the most recent Mortgage that was taken out on this home.
Original Mortgage
$102,250
Interest Rate
7.23%
Mortgage Type
FHA
Create a Home Valuation Report for This Property
The Home Valuation Report is an in-depth analysis detailing your home's value as well as a comparison with similar homes in the area
Home Values in the Area
Average Home Value in this Area
Purchase History
| Date | Buyer | Sale Price | Title Company |
|---|---|---|---|
| Jay & Amanda Stewart Living Trust | -- | None Available | |
| Stewart Jay A | $145,000 | Security Title Agency | |
| Jenkins Jeffrey | $102,888 | Chicago Title Insurance Co |
Source: Public Records
Mortgage History
| Date | Status | Borrower | Loan Amount |
|---|---|---|---|
| Open | Stewart Jay A | $35,000 | |
| Previous Owner | Jenkins Jeffrey | $102,250 |
Source: Public Records
Tax History Compared to Growth
Tax History
| Year | Tax Paid | Tax Assessment Tax Assessment Total Assessment is a certain percentage of the fair market value that is determined by local assessors to be the total taxable value of land and additions on the property. | Land | Improvement |
|---|---|---|---|---|
| 2025 | $1,264 | $11,796 | -- | -- |
| 2024 | $1,240 | $11,234 | -- | -- |
| 2023 | $1,240 | $28,260 | $5,650 | $22,610 |
| 2022 | $1,196 | $21,680 | $4,330 | $17,350 |
| 2021 | $1,226 | $19,960 | $3,990 | $15,970 |
| 2020 | $1,193 | $18,430 | $3,680 | $14,750 |
| 2019 | $1,171 | $16,420 | $3,280 | $13,140 |
| 2018 | $1,138 | $15,370 | $3,070 | $12,300 |
| 2017 | $1,135 | $13,580 | $2,710 | $10,870 |
| 2016 | $1,115 | $12,810 | $2,560 | $10,250 |
| 2015 | $1,034 | $12,620 | $2,520 | $10,100 |
Source: Public Records
Map
Nearby Homes
- 10223 N 40th Ave
- 10619 N 38th Ave
- 3716 W Peoria Ave
- 3931 W Christy Dr
- 3926 W Christy Dr Unit 1
- 4062 W Camino Acequia
- 3801 W Mercer Ln Unit 2
- 10852 N 39th Ave
- 3646 W Brown St
- 3836 W Desert Cove Ave
- 10016 N 39th Dr
- 4117 W Camino Acequia
- 3628 W Brown St
- 10220 N 36th Ave
- 10713 N 36th Ave
- 4111 W Desert Cove Ave
- 3516 W Brown St
- 11208 N 38th Ave
- 11215 N 38th Ave
- 3824 W Carol Ave
- 3848 W Cochise Dr
- 3842 W Cochise Dr
- 3854 W Cochise Dr
- 3847 W North Ln
- 3853 W North Ln
- 3841 W North Ln
- 3847 W Cochise Dr
- 3836 W Cochise Dr
- 3853 W Cochise Dr
- 3841 W Cochise Dr
- 3835 W North Ln
- 3830 W Cochise Dr
- 3835 W Cochise Dr
- 3829 W North Ln
- 10242 N 39th Ave
- 10235 N 39th Ave
- 3848 W North Ln Unit 5
- 3854 W North Ln
- 3842 W North Ln
- 3826 W Beryl Ave