B
Seller's Agent in 2020
Brian Kelly
HomeSmart
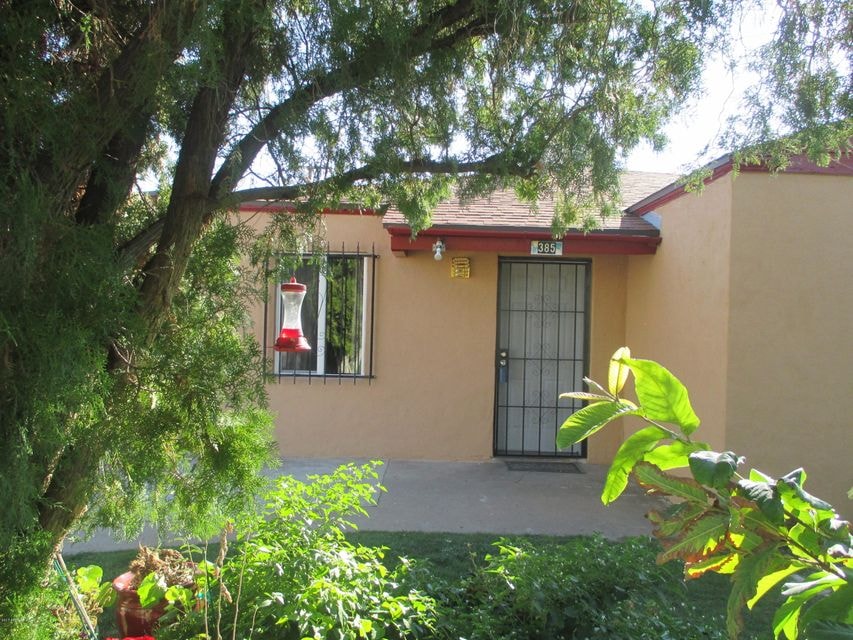
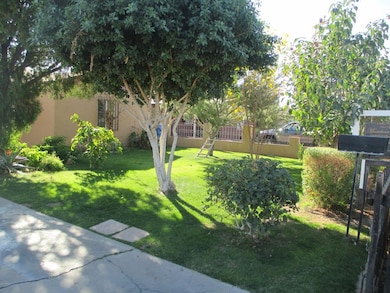

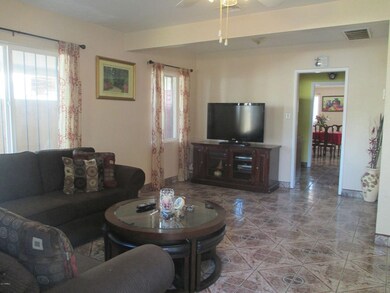
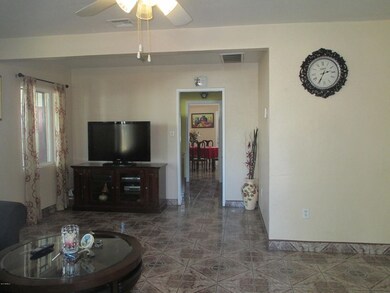
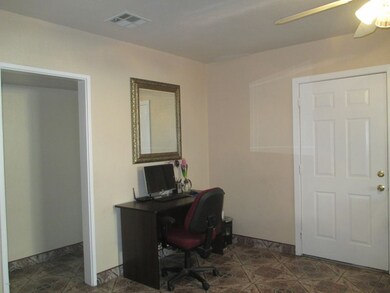
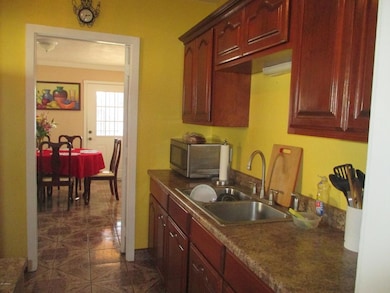
CENTRAL PHOENIX LOCATION. This charming 3 bedroom, 1 bath is centrally located close to great restaurants, shopping, light rail, and downtown where you can enjoy different activities every day. Owner has taken great care of this home and is move-in ready.
Last Agent to Sell the Property
Realty ONE Group License #SA575089000 Listed on: 01/20/2017
| Date | Type | Sale Price | Title Company |
|---|---|---|---|
| Warranty Deed | $260,000 | Equitable Title Agency | |
| Special Warranty Deed | $199,900 | American Title Service Agenc | |
| Warranty Deed | $195,000 | Empire West Title Agency Llc | |
| Interfamily Deed Transfer | -- | None Available | |
| Warranty Deed | -- | Driggs Title Agency Inc | |
| Interfamily Deed Transfer | -- | None Available | |
| Joint Tenancy Deed | $47,000 | -- | |
| Cash Sale Deed | $15,000 | Security Title Agency |
| Date | Status | Loan Amount | Loan Type |
|---|---|---|---|
| Open | $255,290 | FHA | |
| Previous Owner | $160,000 | Stand Alone First | |
| Previous Owner | $184,500 | New Conventional | |
| Previous Owner | $44,650 | New Conventional | |
| Closed | $1,200 | No Value Available |
| Date | Event | Price | Change | Sq Ft Price |
|---|---|---|---|---|
| 02/07/2020 02/07/20 | Sold | $260,000 | -3.7% | $200 / Sq Ft |
| 01/08/2020 01/08/20 | Pending | -- | -- | -- |
| 01/03/2020 01/03/20 | Price Changed | $269,900 | -1.5% | $207 / Sq Ft |
| 12/30/2019 12/30/19 | For Sale | $273,900 | 0.0% | $210 / Sq Ft |
| 12/15/2019 12/15/19 | Pending | -- | -- | -- |
| 12/10/2019 12/10/19 | Price Changed | $273,900 | -2.0% | $210 / Sq Ft |
| 12/10/2019 12/10/19 | For Sale | $279,500 | +7.5% | $215 / Sq Ft |
| 12/09/2019 12/09/19 | Off Market | $260,000 | -- | -- |
| 10/11/2019 10/11/19 | Price Changed | $279,500 | -3.5% | $215 / Sq Ft |
| 09/06/2019 09/06/19 | Price Changed | $289,500 | -1.9% | $222 / Sq Ft |
| 08/16/2019 08/16/19 | Price Changed | $294,999 | -1.5% | $227 / Sq Ft |
| 08/02/2019 08/02/19 | Price Changed | $299,499 | -0.2% | $230 / Sq Ft |
| 07/13/2019 07/13/19 | Price Changed | $299,999 | -3.2% | $230 / Sq Ft |
| 06/26/2019 06/26/19 | Price Changed | $309,900 | -2.9% | $238 / Sq Ft |
| 06/20/2019 06/20/19 | For Sale | $319,000 | +63.6% | $245 / Sq Ft |
| 05/25/2018 05/25/18 | Sold | $195,000 | -9.3% | $150 / Sq Ft |
| 05/12/2018 05/12/18 | Price Changed | $215,000 | -6.5% | $165 / Sq Ft |
| 05/07/2018 05/07/18 | Pending | -- | -- | -- |
| 05/06/2018 05/06/18 | For Sale | $230,000 | +12.2% | $177 / Sq Ft |
| 09/15/2017 09/15/17 | Sold | $205,000 | 0.0% | $157 / Sq Ft |
| 07/14/2017 07/14/17 | Price Changed | $205,000 | -1.4% | $157 / Sq Ft |
| 07/08/2017 07/08/17 | Price Changed | $208,000 | -0.5% | $160 / Sq Ft |
| 07/04/2017 07/04/17 | Price Changed | $209,000 | -0.5% | $161 / Sq Ft |
| 06/24/2017 06/24/17 | Price Changed | $210,000 | -1.4% | $161 / Sq Ft |
| 06/19/2017 06/19/17 | Price Changed | $213,000 | -0.9% | $164 / Sq Ft |
| 05/31/2017 05/31/17 | Price Changed | $215,000 | -2.3% | $165 / Sq Ft |
| 05/18/2017 05/18/17 | Price Changed | $220,000 | -1.8% | $169 / Sq Ft |
| 04/18/2017 04/18/17 | Price Changed | $224,000 | -0.4% | $172 / Sq Ft |
| 04/09/2017 04/09/17 | Price Changed | $225,000 | -0.4% | $173 / Sq Ft |
| 04/05/2017 04/05/17 | Price Changed | $226,000 | -0.4% | $174 / Sq Ft |
| 04/01/2017 04/01/17 | Price Changed | $227,000 | -0.4% | $174 / Sq Ft |
| 03/29/2017 03/29/17 | Price Changed | $228,000 | -0.4% | $175 / Sq Ft |
| 03/23/2017 03/23/17 | Price Changed | $229,000 | -1.5% | $176 / Sq Ft |
| 03/12/2017 03/12/17 | Price Changed | $232,500 | -1.1% | $179 / Sq Ft |
| 02/23/2017 02/23/17 | Price Changed | $235,000 | -2.1% | $180 / Sq Ft |
| 02/19/2017 02/19/17 | Price Changed | $240,000 | -1.0% | $184 / Sq Ft |
| 02/09/2017 02/09/17 | Price Changed | $242,500 | -0.2% | $186 / Sq Ft |
| 01/30/2017 01/30/17 | Price Changed | $243,000 | -0.8% | $187 / Sq Ft |
| 01/20/2017 01/20/17 | For Sale | $245,000 | -- | $188 / Sq Ft |
| Year | Tax Paid | Tax Assessment Tax Assessment Total Assessment is a certain percentage of the fair market value that is determined by local assessors to be the total taxable value of land and additions on the property. | Land | Improvement |
|---|---|---|---|---|
| 2025 | $1,670 | $15,136 | -- | -- |
| 2024 | $1,608 | $14,415 | -- | -- |
| 2023 | $1,608 | $30,010 | $6,000 | $24,010 |
| 2022 | $1,601 | $22,660 | $4,530 | $18,130 |
| 2021 | $1,648 | $21,560 | $4,310 | $17,250 |
| 2020 | $1,603 | $19,230 | $3,840 | $15,390 |
| 2019 | $1,730 | $18,270 | $3,650 | $14,620 |
| 2018 | $1,673 | $19,020 | $3,800 | $15,220 |
| 2017 | $1,340 | $13,480 | $2,690 | $10,790 |
| 2016 | $623 | $9,170 | $1,830 | $7,340 |
| 2015 | $580 | $9,000 | $1,800 | $7,200 |
B
Seller's Agent in 2020
Brian Kelly
HomeSmart

Buyer's Agent in 2020
Adam Coburn
HomeSmart
(602) 456-2624
29 Total Sales
D
Seller's Agent in 2018
Darrian Owens
HomeSmart
D
Buyer's Agent in 2018
Dustin Posey
Catalyst Realty LLC
Seller's Agent in 2017
Marielena Krebs
Realty One Group
(602) 318-6567
47 Total Sales
Buyer's Agent in 2017
Michelle Houze
Compass
(480) 206-1313
89 Total Sales
Source: Arizona Regional Multiple Listing Service (ARMLS)
MLS Number: 5549760
APN: 118-23-055
Disclaimer: Certain information contained herein is derived from information provided by parties other than Homes.com. All information provided is deemed reliable, but is not guaranteed to be accurate and should be independently verified.
![]() All information should be verified by the recipient and none is guaranteed as accurate by ARMLS
All information should be verified by the recipient and none is guaranteed as accurate by ARMLS
Listing Information presented by local MLS brokerage: Ten-X, local REALTOR®- Arlene Richardson - (888)-952-6393