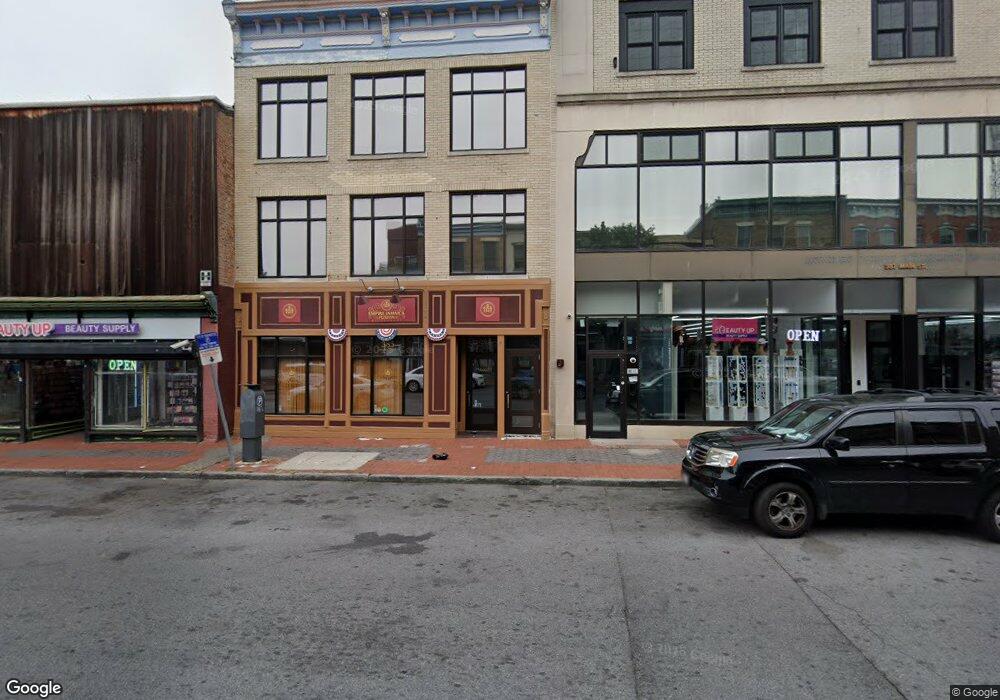
385 Main St Poughkeepsie, NY 12601
Estimated Value: $384,000
Studio
--
Bath
1,500
Sq Ft
$256/Sq Ft
Est. Value
About This Home
This home is located at 385 Main St, Poughkeepsie, NY 12601 and is currently estimated at $384,000, approximately $256 per square foot. 385 Main St is a home located in Dutchess County with nearby schools including Poughkeepsie High School and Holy Trinity School.
Ownership History
Date
Name
Owned For
Owner Type
Purchase Details
Closed on
Dec 7, 2022
Sold by
Yeung Shing F and Chen Jin X
Bought by
Hang Seng Llc
Current Estimated Value
Purchase Details
Closed on
Jan 7, 2016
Sold by
Rhinebeck Bank
Bought by
Yeung Shing and Yeung Chen
Purchase Details
Closed on
Sep 20, 2013
Sold by
Mccormack Building Llc T
Bought by
Rhinebeck Bank
Purchase Details
Closed on
Sep 26, 2006
Sold by
Mccormack Timothy
Bought by
Mccormack Building Llc
Home Financials for this Owner
Home Financials are based on the most recent Mortgage that was taken out on this home.
Original Mortgage
$627,171
Interest Rate
6.54%
Mortgage Type
Commercial
Purchase Details
Closed on
Aug 9, 1994
Sold by
Est Of Thomas J Mc Cormack
Bought by
Mccormack Timothy J
Create a Home Valuation Report for This Property
The Home Valuation Report is an in-depth analysis detailing your home's value as well as a comparison with similar homes in the area
Home Values in the Area
Average Home Value in this Area
Purchase History
| Date | Buyer | Sale Price | Title Company |
|---|---|---|---|
| Hang Seng Llc | -- | None Available | |
| Yeung Shing | $192,000 | -- | |
| Yeung Shing | $192,000 | -- | |
| Rhinebeck Bank | $523,407 | -- | |
| Rhinebeck Bank | $523,407 | -- | |
| Mccormack Building Llc | -- | -- | |
| Mccormack Building Llc | -- | -- | |
| Mccormack Timothy J | -- | -- | |
| Mccormack Timothy J | -- | -- |
Source: Public Records
Mortgage History
| Date | Status | Borrower | Loan Amount |
|---|---|---|---|
| Previous Owner | Mccormack Building Llc | $627,171 |
Source: Public Records
Tax History
| Year | Tax Paid | Tax Assessment Tax Assessment Total Assessment is a certain percentage of the fair market value that is determined by local assessors to be the total taxable value of land and additions on the property. | Land | Improvement |
|---|---|---|---|---|
| 2024 | $12,352 | $355,400 | $52,800 | $302,600 |
| 2023 | $11,378 | $341,700 | $52,800 | $288,900 |
| 2022 | $12,149 | $310,600 | $48,000 | $262,600 |
| 2021 | $12,601 | $310,600 | $48,000 | $262,600 |
| 2020 | $12,791 | $304,500 | $48,000 | $256,500 |
| 2019 | $12,721 | $290,000 | $48,000 | $242,000 |
| 2018 | $13,179 | $290,000 | $48,000 | $242,000 |
| 2017 | $11,803 | $290,000 | $48,000 | $242,000 |
| 2016 | $10,551 | $300,000 | $48,000 | $252,000 |
| 2015 | -- | $300,000 | $48,000 | $252,000 |
| 2014 | -- | $332,500 | $48,000 | $284,500 |
Source: Public Records
Map
Nearby Homes
- 387 Main St Unit 406
- 387 Main St Unit 202
- 387 Main St
- 381 Main St
- 302304 Main St
- 386 Main St
- 386 Main St Unit 3A
- 386 Main St Unit 3G
- 392 Main St
- 390 Main St
- 380 Main St Unit C
- 380 Main St Unit B
- 394 Main St
- 6 Crannell St
- 367 Main St
- 396 Main St
- 403 Main St
- 1 N Hamilton St
- 399 Main St Unit 4B
- 399 Main St Unit 3A
Your Personal Tour Guide
Ask me questions while you tour the home.