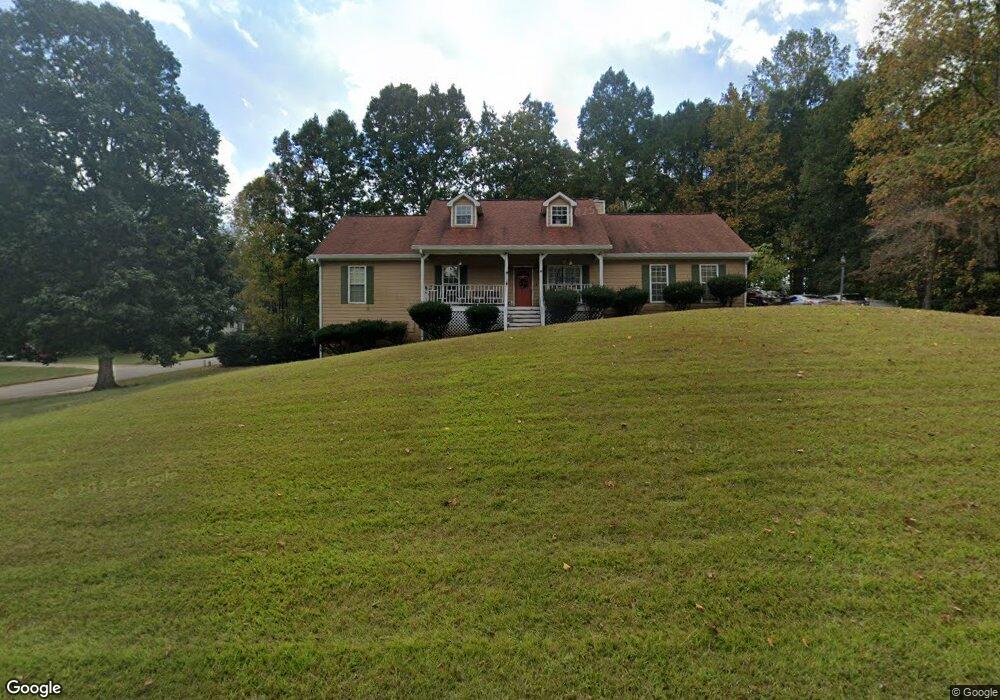
385 Mckenzie Dr Stockbridge, GA 30281
Estimated Value: $375,000 - $408,000
4
Beds
3
Baths
3,710
Sq Ft
$106/Sq Ft
Est. Value
About This Home
This home is located at 385 Mckenzie Dr, Stockbridge, GA 30281 and is currently estimated at $394,455, approximately $106 per square foot. 385 Mckenzie Dr is a home located in Henry County with nearby schools including Woodland Elementary School, Woodland Middle School, and Woodland High School.
Ownership History
Date
Name
Owned For
Owner Type
Purchase Details
Closed on
Jul 10, 2025
Sold by
Nguyen Christopher Huu
Bought by
Huynh Mai T
Current Estimated Value
Home Financials for this Owner
Home Financials are based on the most recent Mortgage that was taken out on this home.
Original Mortgage
$201,000
Outstanding Balance
$200,659
Interest Rate
6.84%
Mortgage Type
New Conventional
Estimated Equity
$193,796
Purchase Details
Closed on
Jul 9, 2018
Sold by
Huynh Mai T
Bought by
Huynh Mai T and Nguyen Christopher Huu
Home Financials for this Owner
Home Financials are based on the most recent Mortgage that was taken out on this home.
Original Mortgage
$146,900
Interest Rate
5.38%
Mortgage Type
New Conventional
Purchase Details
Closed on
Jul 30, 2001
Sold by
Scarborough Ronald S
Bought by
Smith Jeffrey M and Smith Connie C
Home Financials for this Owner
Home Financials are based on the most recent Mortgage that was taken out on this home.
Original Mortgage
$130,300
Interest Rate
7.09%
Mortgage Type
New Conventional
Create a Home Valuation Report for This Property
The Home Valuation Report is an in-depth analysis detailing your home's value as well as a comparison with similar homes in the area
Home Values in the Area
Average Home Value in this Area
Purchase History
| Date | Buyer | Sale Price | Title Company |
|---|---|---|---|
| Huynh Mai T | -- | -- | |
| Huynh Mai T | -- | -- | |
| Huynh Mai T | $226,100 | -- | |
| Smith Jeffrey M | $162,900 | -- |
Source: Public Records
Mortgage History
| Date | Status | Borrower | Loan Amount |
|---|---|---|---|
| Open | Huynh Mai T | $201,000 | |
| Previous Owner | Huynh Mai T | $146,900 | |
| Previous Owner | Smith Jeffrey M | $130,300 |
Source: Public Records
Tax History Compared to Growth
Tax History
| Year | Tax Paid | Tax Assessment Tax Assessment Total Assessment is a certain percentage of the fair market value that is determined by local assessors to be the total taxable value of land and additions on the property. | Land | Improvement |
|---|---|---|---|---|
| 2025 | $6,339 | $158,704 | $18,000 | $140,704 |
| 2024 | $6,339 | $152,440 | $18,000 | $134,440 |
| 2023 | $5,899 | $152,080 | $16,000 | $136,080 |
| 2022 | $4,770 | $122,640 | $12,000 | $110,640 |
| 2021 | $4,058 | $104,080 | $12,000 | $92,080 |
| 2020 | $3,831 | $98,160 | $10,800 | $87,360 |
| 2019 | $3,535 | $90,440 | $10,310 | $80,130 |
| 2018 | $2,731 | $78,640 | $10,000 | $68,640 |
| 2016 | $2,300 | $65,320 | $10,000 | $55,320 |
| 2015 | $2,065 | $57,840 | $7,200 | $50,640 |
| 2014 | $1,962 | $54,760 | $7,200 | $47,560 |
Source: Public Records
Map
Nearby Homes
- 0 Mckenzie Ave Unit 10593345
- 564 Mckenzie Ave
- 719 Erin Dr
- 320 Mckenzie Dr
- 608 Mckenzie Cir
- 805 Anna Kathryn Dr
- 825 Anna Kathryn Dr
- 809 Anna Kathryn Dr
- 807 Anna Kathryn Dr
- 829 Anna Kathryn Dr
- 830 Anna Kathryn Dr
- 811 Anna Kathryn Dr
- 831 Anna Kathryn Dr
- 813 Anna Kathryn Dr
- 164 Mckenzie Ct
- 95 Fern Ct
- 551 Hood Rd
- 65 Wynfield Dr
- 1720 Highway 138 E
- 1810 Highway 138 E
- 104 New Hood Rd
- 389 Mckenzie Dr
- 392 Mckenzie Dr
- 384 Mckenzie Dr
- 108 New Hood Rd
- 396 Mckenzie Dr
- 704 Erin Dr
- 397 Mckenzie Dr
- 357 Mckenzie Dr
- 109 New Hood Rd Unit 1
- 109 New Hood Rd
- 536 Mckenzie Ave
- 368 Mckenzie Dr
- 538 Mckenzie Ave
- 398 Mckenzie Dr
- 528 Mckenzie Ave
- 540 Mckenzie Ave
- 360 Mckenzie Dr
- 716 Erin Dr
- 707 Erin Dr