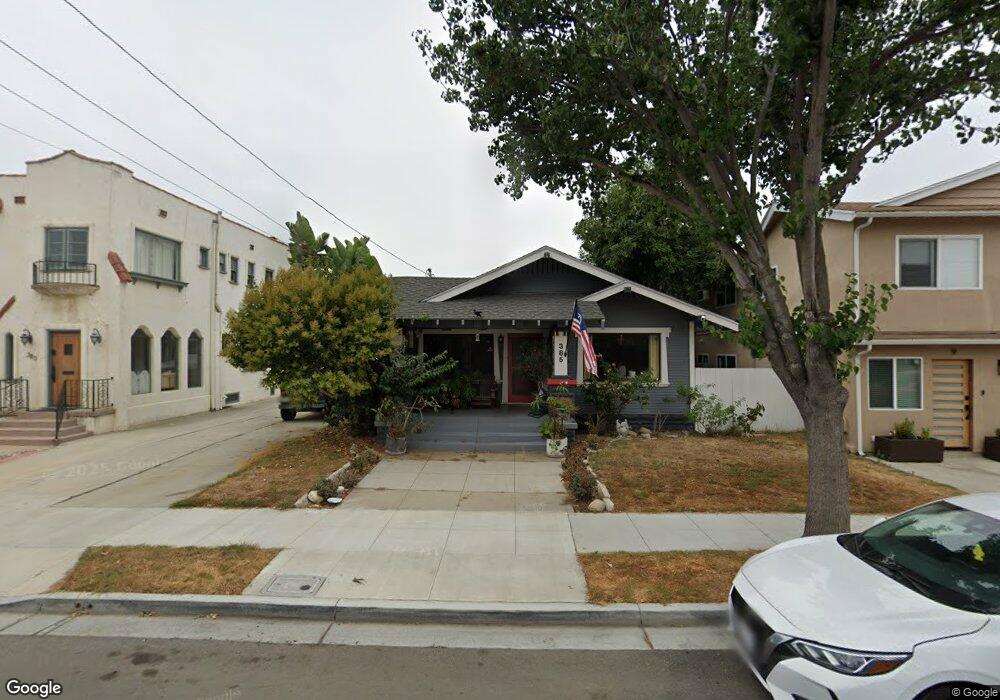
385 Molino Ave Long Beach, CA 90814
Bluff Heights NeighborhoodEstimated Value: $929,000 - $1,292,000
3
Beds
2
Baths
1,343
Sq Ft
$879/Sq Ft
Est. Value
About This Home
This home is located at 385 Molino Ave, Long Beach, CA 90814 and is currently estimated at $1,180,115, approximately $878 per square foot. 385 Molino Ave is a home located in Los Angeles County with nearby schools including Burbank Elementary School, Woodrow Wilson High School, and Maple Village Waldorf School.
Ownership History
Date
Name
Owned For
Owner Type
Purchase Details
Closed on
Sep 28, 2005
Sold by
Rivalsky Mary and Gildard Trisa
Bought by
Rivalsky Mary
Current Estimated Value
Home Financials for this Owner
Home Financials are based on the most recent Mortgage that was taken out on this home.
Original Mortgage
$537,000
Outstanding Balance
$282,702
Interest Rate
5.5%
Mortgage Type
New Conventional
Estimated Equity
$897,413
Purchase Details
Closed on
Feb 4, 2005
Sold by
James Katherine
Bought by
Gildard Trisa
Home Financials for this Owner
Home Financials are based on the most recent Mortgage that was taken out on this home.
Original Mortgage
$520,000
Interest Rate
5.65%
Mortgage Type
New Conventional
Purchase Details
Closed on
Mar 14, 1996
Sold by
The Prudential Home Mtg Company Inc
Bought by
James Katherine
Purchase Details
Closed on
Dec 15, 1995
Sold by
Avila Richard and Avila Bradshaw Susan Carolyn
Bought by
The Prudential Home Mtg Company Inc
Create a Home Valuation Report for This Property
The Home Valuation Report is an in-depth analysis detailing your home's value as well as a comparison with similar homes in the area
Home Values in the Area
Average Home Value in this Area
Purchase History
| Date | Buyer | Sale Price | Title Company |
|---|---|---|---|
| Rivalsky Mary | -- | Fidelity National Title | |
| Gildard Trisa | $650,000 | Fidelity National Title Co | |
| James Katherine | $160,000 | North American Title Co | |
| The Prudential Home Mtg Company Inc | $171,000 | Chicago Title Co |
Source: Public Records
Mortgage History
| Date | Status | Borrower | Loan Amount |
|---|---|---|---|
| Open | Rivalsky Mary | $537,000 | |
| Closed | Gildard Trisa | $520,000 |
Source: Public Records
Tax History
| Year | Tax Paid | Tax Assessment Tax Assessment Total Assessment is a certain percentage of the fair market value that is determined by local assessors to be the total taxable value of land and additions on the property. | Land | Improvement |
|---|---|---|---|---|
| 2025 | $11,786 | $938,147 | $738,223 | $199,924 |
| 2024 | $11,786 | $919,753 | $723,749 | $196,004 |
| 2023 | $11,589 | $901,719 | $709,558 | $192,161 |
| 2022 | $10,875 | $884,040 | $695,646 | $188,394 |
| 2021 | $10,667 | $866,706 | $682,006 | $184,700 |
| 2019 | $9,679 | $772,000 | $578,000 | $194,000 |
| 2018 | $9,530 | $772,000 | $578,000 | $194,000 |
| 2016 | $8,917 | $755,000 | $565,000 | $190,000 |
| 2015 | $7,105 | $615,000 | $460,000 | $155,000 |
| 2014 | $7,189 | $615,000 | $460,000 | $155,000 |
Source: Public Records
Map
Nearby Homes
- 346 Molino Ave
- 2820 E Colorado St
- 361 Gladys Ave
- 366 Gladys Ave
- 2439 E 6th St
- 2805 E 3rd St Unit 21
- 645 Ohio Ave Unit 402
- 280 Molino Ave Unit 108
- 2135 E Florida St Unit 7
- 287 Kennebec Ave
- 241 Lindero Ave
- 672 Junipero Ave
- 625 Orizaba Ave Unit 6
- 3020 E 3rd St
- 232 Junipero Ave Unit B1
- 720 Stanley Ave
- 743 Ohio Ave
- 606 Dawson Ave
- 456 Cherry Ave
- 3045 E Theresa St Unit 1
- 383 Molino Ave
- 393 Molino Ave
- 377 Molino Ave
- 386 Wisconsin Ave
- 384 Wisconsin Ave
- 373 Molino Ave
- 399 Molino Ave
- 2600 E 4th St
- 390 Wisconsin Ave Unit 201
- 2500 E 4th St
- 2500 E 4th St Unit 307
- 2500 E 4th St Unit 306
- 2500 E 4th St Unit 305
- 2500 E 4th St Unit 304
- 2500 E 4th St Unit 303
- 2500 E 4th St Unit 302
- 2500 E 4th St Unit 301
- 2500 E 4th St Unit 208
- 2500 E 4th St Unit 207
- 2500 E 4th St Unit 206
Your Personal Tour Guide
Ask me questions while you tour the home.