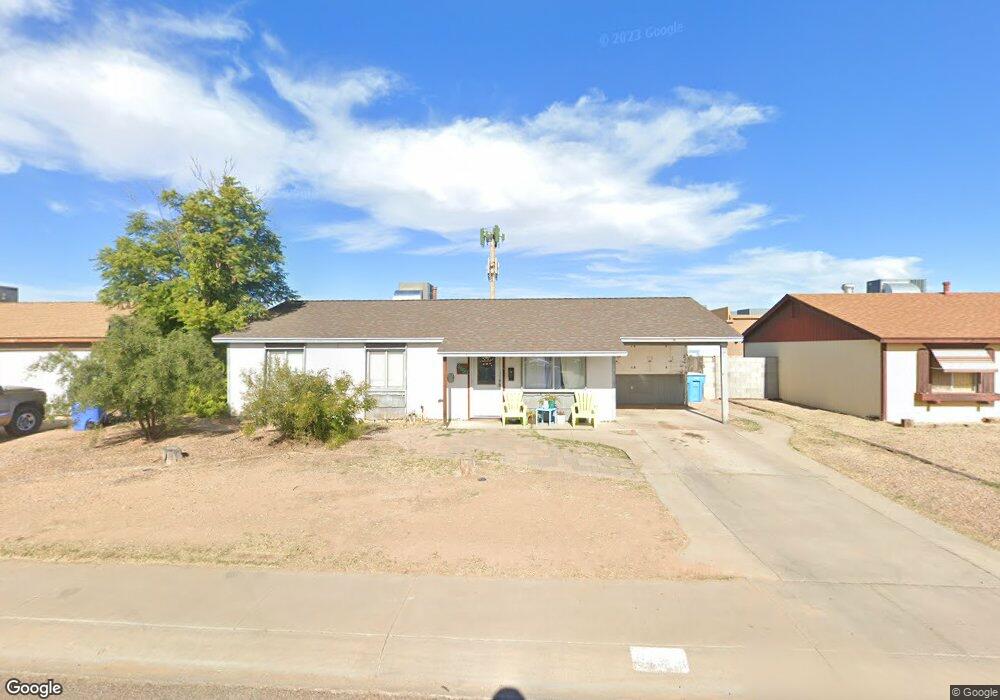
3850 E Eugie Ave Phoenix, AZ 85032
Paradise Valley Village NeighborhoodEstimated Value: $318,000 - $399,000
Studio
2
Baths
1,204
Sq Ft
$303/Sq Ft
Est. Value
About This Home
This home is located at 3850 E Eugie Ave, Phoenix, AZ 85032 and is currently estimated at $364,429, approximately $302 per square foot. 3850 E Eugie Ave is a home located in Maricopa County with nearby schools including Indian Bend Elementary School, Shea Middle School, and Shadow Mountain High School.
Ownership History
Date
Name
Owned For
Owner Type
Purchase Details
Closed on
Feb 18, 2026
Sold by
Coffey James and Coffey Tamara
Bought by
Coffey James M
Current Estimated Value
Home Financials for this Owner
Home Financials are based on the most recent Mortgage that was taken out on this home.
Original Mortgage
$152,950
Outstanding Balance
$152,950
Interest Rate
6.06%
Mortgage Type
New Conventional
Estimated Equity
$211,479
Purchase Details
Closed on
Jan 9, 2024
Sold by
Martin Kevin
Bought by
Coffey James and Coffey Tamara
Home Financials for this Owner
Home Financials are based on the most recent Mortgage that was taken out on this home.
Original Mortgage
$275,500
Interest Rate
7.29%
Mortgage Type
New Conventional
Purchase Details
Closed on
May 12, 2004
Sold by
Pioske Lee
Bought by
Martin Kevin
Home Financials for this Owner
Home Financials are based on the most recent Mortgage that was taken out on this home.
Original Mortgage
$110,200
Interest Rate
7.2%
Mortgage Type
FHA
Purchase Details
Closed on
Feb 5, 2001
Sold by
Moore Elaine L
Bought by
Pioske Lee
Home Financials for this Owner
Home Financials are based on the most recent Mortgage that was taken out on this home.
Original Mortgage
$76,000
Interest Rate
7.11%
Mortgage Type
New Conventional
Create a Home Valuation Report for This Property
The Home Valuation Report is an in-depth analysis detailing your home's value as well as a comparison with similar homes in the area
Home Values in the Area
Average Home Value in this Area
Purchase History
| Date | Buyer | Sale Price | Title Company |
|---|---|---|---|
| Coffey James M | $350,000 | Magnus Title Agency | |
| Coffey James | $290,000 | Magnus Title Agency | |
| Martin Kevin | $112,825 | Grand Canyon Title Agency In | |
| Pioske Lee | $95,000 | Stewart Title & Trust |
Source: Public Records
Mortgage History
| Date | Status | Borrower | Loan Amount |
|---|---|---|---|
| Open | Coffey James M | $152,950 | |
| Previous Owner | Coffey James | $275,500 | |
| Previous Owner | Martin Kevin | $110,200 | |
| Previous Owner | Pioske Lee | $76,000 | |
| Closed | Pioske Lee | $19,000 |
Source: Public Records
Tax History
| Year | Tax Paid | Tax Assessment Tax Assessment Total Assessment is a certain percentage of the fair market value that is determined by local assessors to be the total taxable value of land and additions on the property. | Land | Improvement |
|---|---|---|---|---|
| 2025 | $1,103 | $12,737 | -- | -- |
| 2024 | $1,050 | $12,130 | -- | -- |
| 2023 | $1,050 | $28,330 | $5,660 | $22,670 |
| 2022 | $1,040 | $22,480 | $4,490 | $17,990 |
| 2021 | $1,058 | $19,380 | $3,870 | $15,510 |
| 2020 | $1,021 | $17,580 | $3,510 | $14,070 |
| 2019 | $1,026 | $15,330 | $3,060 | $12,270 |
| 2018 | $989 | $13,530 | $2,700 | $10,830 |
| 2017 | $944 | $12,870 | $2,570 | $10,300 |
| 2016 | $929 | $11,620 | $2,320 | $9,300 |
| 2015 | $862 | $12,150 | $2,430 | $9,720 |
Source: Public Records
Map
Nearby Homes
- 3826 E Eugie Ave
- 13642 N 38th St
- 13250 N 38th St
- 13238 N 38th Place
- 13822 N 38th Place
- 3932 E Surrey Ave
- 3765 E Pershing Ave
- 13616 N 41st Place
- 14010 N 40th Place
- 4012 E Captain Dreyfus Ave
- 13629 N 36th St
- 3540 E Voltaire Dr
- 14043 N 41st St
- 13818 N 43rd St
- 13805 N 43rd St
- 13813 N 43rd St
- 3628 E Hearn Rd
- 3633 E Sweetwater Ave
- 3471 E Delcoa Dr
- 3512 E Willow Ave
- 3902 E Eugie Ave
- 3846 E Eugie Ave
- 3910 E Eugie Ave
- 3842 E Eugie Ave
- 3849 E Eugie Ave
- 3901 E Eugie Ave
- 3843 E Eugie Ave
- 3909 E Eugie Ave
- 3837 E Eugie Ave
- 3915 E Eugie Ave
- 3850 E Joan de Arc Ave
- 3830 E Eugie Ave
- 3924 E Eugie Ave
- 3846 E Joan de Arc Ave
- 3831 E Eugie Ave
- 3908 E Joan de Arc Ave
- 3842 E Joan de Arc Ave
- 3923 E Eugie Ave
- 3916 E Joan de Arc Ave
- 3923 E Thunderbird Rd
Your Personal Tour Guide
Ask me questions while you tour the home.