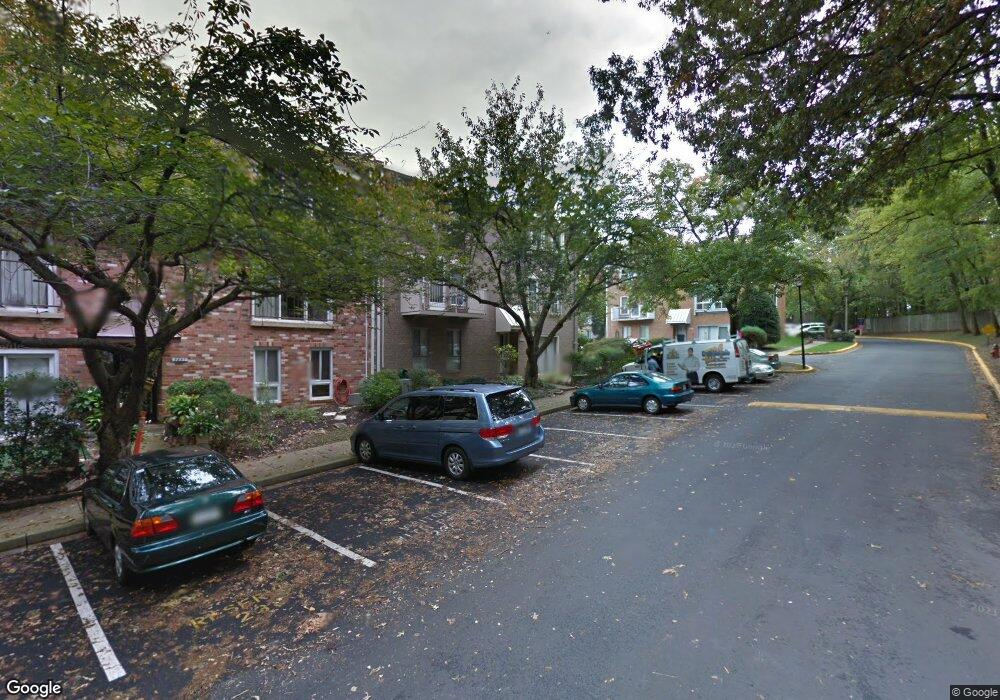
3854 Persimmon Cir Fairfax, VA 22031
Estimated Value: $480,382 - $531,000
3
Beds
3
Baths
1,610
Sq Ft
$310/Sq Ft
Est. Value
About This Home
This home is located at 3854 Persimmon Cir, Fairfax, VA 22031 and is currently estimated at $498,346, approximately $309 per square foot. 3854 Persimmon Cir is a home located in Fairfax County with nearby schools including Mantua Elementary School, Frost Middle School, and W. T. Woodson High School.
Ownership History
Date
Name
Owned For
Owner Type
Purchase Details
Closed on
Jan 9, 2015
Sold by
Cha Andy K
Bought by
Cha Andy K
Current Estimated Value
Purchase Details
Closed on
Mar 31, 2010
Sold by
Swiston Andrew J
Bought by
Cha Andy
Home Financials for this Owner
Home Financials are based on the most recent Mortgage that was taken out on this home.
Original Mortgage
$213,750
Interest Rate
4.94%
Mortgage Type
New Conventional
Purchase Details
Closed on
May 10, 2004
Sold by
Park Se J
Bought by
Swiston Andrew J
Home Financials for this Owner
Home Financials are based on the most recent Mortgage that was taken out on this home.
Original Mortgage
$205,000
Interest Rate
5.39%
Mortgage Type
New Conventional
Purchase Details
Closed on
Dec 27, 2001
Sold by
Mcnally Michael R
Bought by
Park Sang T
Home Financials for this Owner
Home Financials are based on the most recent Mortgage that was taken out on this home.
Original Mortgage
$125,600
Interest Rate
6.61%
Create a Home Valuation Report for This Property
The Home Valuation Report is an in-depth analysis detailing your home's value as well as a comparison with similar homes in the area
Home Values in the Area
Average Home Value in this Area
Purchase History
| Date | Buyer | Sale Price | Title Company |
|---|---|---|---|
| Cha Andy K | -- | -- | |
| Cha Andy | $285,000 | -- | |
| Swiston Andrew J | $256,250 | -- | |
| Park Sang T | $157,000 | -- |
Source: Public Records
Mortgage History
| Date | Status | Borrower | Loan Amount |
|---|---|---|---|
| Previous Owner | Cha Andy | $213,750 | |
| Previous Owner | Swiston Andrew J | $205,000 | |
| Previous Owner | Park Sang T | $125,600 |
Source: Public Records
Tax History Compared to Growth
Tax History
| Year | Tax Paid | Tax Assessment Tax Assessment Total Assessment is a certain percentage of the fair market value that is determined by local assessors to be the total taxable value of land and additions on the property. | Land | Improvement |
|---|---|---|---|---|
| 2025 | $4,781 | $433,280 | $87,000 | $346,280 |
| 2024 | $4,781 | $412,650 | $83,000 | $329,650 |
| 2023 | $4,352 | $385,650 | $77,000 | $308,650 |
| 2022 | $4,009 | $350,590 | $70,000 | $280,590 |
| 2021 | $3,774 | $321,640 | $64,000 | $257,640 |
| 2020 | $3,732 | $315,330 | $63,000 | $252,330 |
| 2019 | $3,635 | $307,180 | $61,000 | $246,180 |
| 2018 | $3,363 | $292,460 | $58,000 | $234,460 |
| 2017 | $3,395 | $292,460 | $58,000 | $234,460 |
| 2016 | $3,422 | $295,410 | $59,000 | $236,410 |
| 2015 | $3,232 | $289,620 | $58,000 | $231,620 |
| 2014 | $3,069 | $275,590 | $55,000 | $220,590 |
Source: Public Records
Map
Nearby Homes
- 3704 Persimmon Cir
- 3814 Persimmon Cir
- 3680 Persimmon Cir
- 3769 Persimmon Cir
- 9350 Tovito Dr
- 9313 Coronado Terrace
- 9368 Tovito Dr
- 3874 Lyndhurst Dr Unit 103
- 3975 Lyndhurst Dr Unit 103
- 9207 Hunting Pines Place
- 9117 Hunting Pines Place
- 3503 Alba Place
- 9308 Ashmeade Dr
- 8920 Walker St
- 4222 Braeburn Dr
- 9450 Silver King Ct Unit 401
- 9017 Ellenwood Ln
- 4301 Braeburn Dr
- 8819 Southwick St
- 9110 Glenbrook Rd
- 3856 Persimmon Cir
- 3860 Persimmon Cir Unit 29
- 3848 Persimmon Cir
- 3837 Persimmon Cir
- 3850 Persimmon Cir
- 3862 Persimmon Cir
- 3858 Persimmon Cir
- 3852 Persimmon Cir
- 3833 Persimmon Cir
- 3835 Persimmon Cir
- 3855 Persimmon Cir
- 3849 Persimmon Cir
- 3822 Persimmon Cir Unit 3822
- 3853 Persimmon Cir
- 3857 Persimmon Cir
- 3851 Persimmon Cir
- 3822 Persimmon Cir Unit 3822
- 3861 Persimmon Cir Unit 3861
- 3818 Persimmon Cir
- 3861 Persimmon Cir