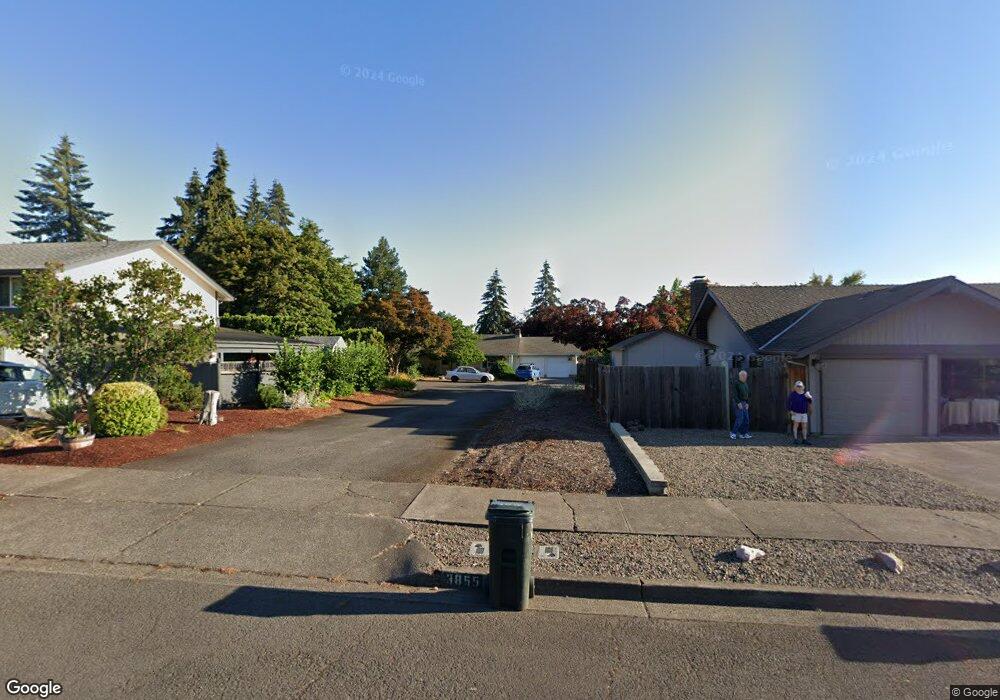
3855 Yorkshire Ave Eugene, OR 97405
Churchill NeighborhoodEstimated Value: $384,769 - $470,000
3
Beds
2
Baths
1,032
Sq Ft
$408/Sq Ft
Est. Value
About This Home
This home is located at 3855 Yorkshire Ave, Eugene, OR 97405 and is currently estimated at $420,692, approximately $407 per square foot. 3855 Yorkshire Ave is a home located in Lane County with nearby schools including McCornack Elementary School, Kennedy Middle School, and Churchill High School.
Ownership History
Date
Name
Owned For
Owner Type
Purchase Details
Closed on
Sep 9, 2003
Sold by
Patras Joshua S
Bought by
Montoya Christopher M and Montoya Carolyn C
Current Estimated Value
Home Financials for this Owner
Home Financials are based on the most recent Mortgage that was taken out on this home.
Original Mortgage
$133,000
Outstanding Balance
$59,138
Interest Rate
5.87%
Mortgage Type
Purchase Money Mortgage
Estimated Equity
$361,554
Purchase Details
Closed on
Mar 22, 2002
Sold by
Schroeder Mark H and Schroeder Sheena A
Bought by
Patras Joshua S and Patras Jennifer M
Home Financials for this Owner
Home Financials are based on the most recent Mortgage that was taken out on this home.
Original Mortgage
$126,022
Interest Rate
6.85%
Mortgage Type
FHA
Create a Home Valuation Report for This Property
The Home Valuation Report is an in-depth analysis detailing your home's value as well as a comparison with similar homes in the area
Home Values in the Area
Average Home Value in this Area
Purchase History
| Date | Buyer | Sale Price | Title Company |
|---|---|---|---|
| Montoya Christopher M | $133,000 | Western Pioneer Title Co | |
| Patras Joshua S | $128,000 | Fidelity National Title Ins |
Source: Public Records
Mortgage History
| Date | Status | Borrower | Loan Amount |
|---|---|---|---|
| Open | Montoya Christopher M | $133,000 | |
| Previous Owner | Patras Joshua S | $126,022 |
Source: Public Records
Tax History
| Year | Tax Paid | Tax Assessment Tax Assessment Total Assessment is a certain percentage of the fair market value that is determined by local assessors to be the total taxable value of land and additions on the property. | Land | Improvement |
|---|---|---|---|---|
| 2025 | $4,327 | $222,095 | -- | -- |
| 2024 | $4,273 | $215,627 | -- | -- |
| 2023 | $4,273 | $209,347 | $0 | $0 |
| 2022 | $4,003 | $203,250 | $0 | $0 |
| 2021 | $3,760 | $197,331 | $0 | $0 |
| 2020 | $3,774 | $191,584 | $0 | $0 |
| 2019 | $3,609 | $186,004 | $0 | $0 |
| 2018 | $3,345 | $175,327 | $0 | $0 |
| 2017 | $3,094 | $175,327 | $0 | $0 |
| 2016 | $2,949 | $170,220 | $0 | $0 |
| 2015 | $2,829 | $165,262 | $0 | $0 |
| 2014 | $2,775 | $160,449 | $0 | $0 |
Source: Public Records
Map
Nearby Homes
- 3837 Kevington Ave
- 3534 Westleigh St
- 3752 Kevington Ave
- 3823 Wilshire Ln
- 3685 Westleigh St
- 1925 Harvard Dr
- 3732 Peppertree Dr
- 2671 Woodstone Place
- 2175 Princeton Dr
- 3705 Peppertree Dr
- 3899 Colony Oaks Dr
- 3845 Colony Oaks Dr
- 2755 Warren St
- 3924 Josh St
- 3817 Colony Oaks Dr
- 3809 Colony Oaks Dr
- 3812 Colony Oaks Dr Unit 28
- 2665 E Wilshire Dr
- 3574 Colony Oaks Dr Unit 6
- 3586 Colony Oaks Dr Unit 5
- 3851 Yorkshire Ave
- 3861 Yorkshire Ave
- 3862 Kevington Ave
- 3865 Yorkshire Ave
- 3845 Yorkshire Ave
- 3860 Kevington Ave
- 3866 Kevington Ave
- 3875 Yorkshire Ave
- 3835 Yorkshire Ave
- 2171 Warren St
- 3850 Yorkshire Ave
- 3863 Kevington Ave
- 3861 Kevington Ave
- 3840 Yorkshire Ave
- 3860 Yorkshire Ave
- 3885 Yorkshire Ave
- 3867 Kevington Ave
- 3825 Yorkshire Ave
- 3859 Kevington Ave
- 2223 Warren St
Your Personal Tour Guide
Ask me questions while you tour the home.