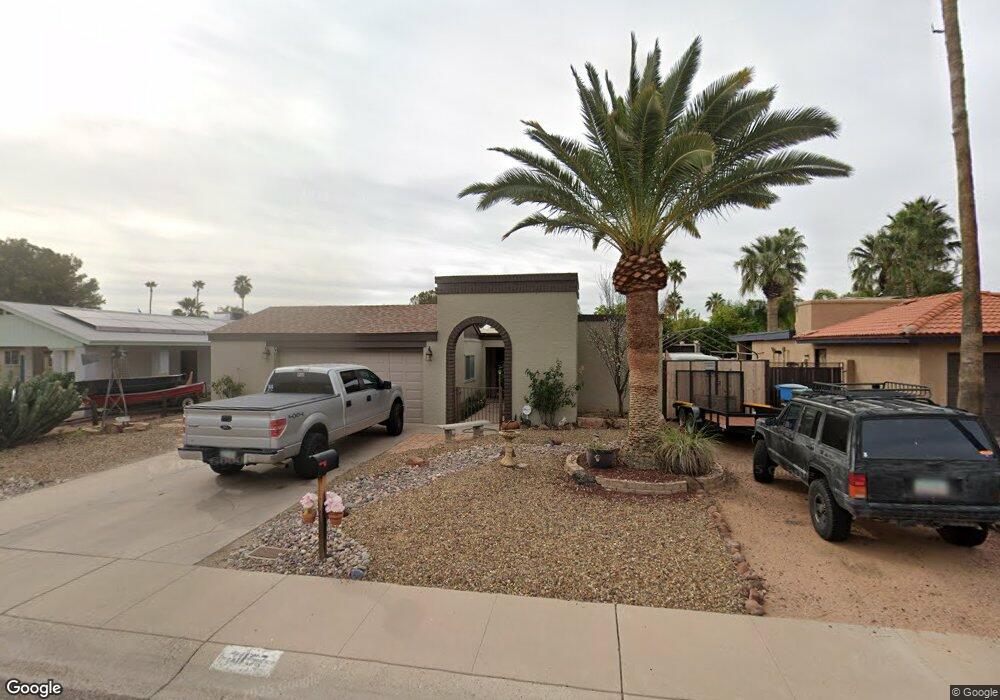
3857 E Windrose Dr Phoenix, AZ 85032
Paradise Valley Village NeighborhoodEstimated Value: $415,000 - $552,000
Studio
2
Baths
1,589
Sq Ft
$302/Sq Ft
Est. Value
About This Home
This home is located at 3857 E Windrose Dr, Phoenix, AZ 85032 and is currently estimated at $479,740, approximately $301 per square foot. 3857 E Windrose Dr is a home located in Maricopa County with nearby schools including Desert Cove Elementary School, Shea Middle School, and Shadow Mountain High School.
Ownership History
Date
Name
Owned For
Owner Type
Purchase Details
Closed on
Oct 17, 2013
Sold by
Betz Kevin M
Bought by
Betz Kevin M and Betz Tamara C
Current Estimated Value
Home Financials for this Owner
Home Financials are based on the most recent Mortgage that was taken out on this home.
Original Mortgage
$130,000
Outstanding Balance
$97,874
Interest Rate
4.55%
Mortgage Type
New Conventional
Estimated Equity
$381,866
Purchase Details
Closed on
May 24, 2001
Sold by
Betz Jamie J
Bought by
Betz Kevin
Home Financials for this Owner
Home Financials are based on the most recent Mortgage that was taken out on this home.
Original Mortgage
$104,000
Interest Rate
7.15%
Purchase Details
Closed on
Jun 8, 1995
Sold by
Tompkins Ronald J
Bought by
Betz Kevin M and Betz Jamie J
Home Financials for this Owner
Home Financials are based on the most recent Mortgage that was taken out on this home.
Original Mortgage
$69,600
Interest Rate
7.63%
Mortgage Type
New Conventional
Purchase Details
Closed on
Oct 1, 1994
Sold by
Tompkins Lori L
Bought by
Tompkins Ronald J
Create a Home Valuation Report for This Property
The Home Valuation Report is an in-depth analysis detailing your home's value as well as a comparison with similar homes in the area
Home Values in the Area
Average Home Value in this Area
Purchase History
| Date | Buyer | Sale Price | Title Company |
|---|---|---|---|
| Betz Kevin M | -- | Dhi Title Agency | |
| Betz Kevin | -- | United Title Agency | |
| Betz Kevin M | $87,000 | Fidelity Title | |
| Tompkins Ronald J | -- | -- |
Source: Public Records
Mortgage History
| Date | Status | Borrower | Loan Amount |
|---|---|---|---|
| Open | Betz Kevin M | $130,000 | |
| Closed | Betz Kevin | $104,000 | |
| Previous Owner | Betz Kevin M | $69,600 |
Source: Public Records
Tax History
| Year | Tax Paid | Tax Assessment Tax Assessment Total Assessment is a certain percentage of the fair market value that is determined by local assessors to be the total taxable value of land and additions on the property. | Land | Improvement |
|---|---|---|---|---|
| 2025 | $1,486 | $17,158 | -- | -- |
| 2024 | $1,415 | $16,341 | -- | -- |
| 2023 | $1,415 | $34,050 | $6,810 | $27,240 |
| 2022 | $1,401 | $26,950 | $5,390 | $21,560 |
| 2021 | $1,425 | $23,970 | $4,790 | $19,180 |
| 2020 | $1,376 | $22,620 | $4,520 | $18,100 |
| 2019 | $1,382 | $20,960 | $4,190 | $16,770 |
| 2018 | $1,332 | $19,100 | $3,820 | $15,280 |
| 2017 | $1,272 | $18,410 | $3,680 | $14,730 |
| 2016 | $1,252 | $17,360 | $3,470 | $13,890 |
| 2015 | $1,161 | $15,520 | $3,100 | $12,420 |
Source: Public Records
Map
Nearby Homes
- 3915 E Windrose Dr
- 4011 E Charter Oak Rd
- 3746 E Aster Dr
- 4019 E Charter Oak Rd
- 4033 E Dahlia Dr Unit 2
- 4012 E Captain Dreyfus Ave
- 3630 E Marmora St
- 3633 E Sweetwater Ave
- 4150 E Cactus Rd Unit 213
- 4150 E Cactus Rd Unit 210
- 3621 E Bloomfield Rd
- 3620 E Charter Oak Rd
- 13250 N 38th St
- 3725 E Paradise Dr
- 11845 N 40th Place
- 11837 N 40th Place
- 12101 N 36th St
- 3508 E Larkspur Dr
- 3444 E Windrose Dr
- 4028 E Sunnyside Dr
- 3901 E Windrose Dr
- 3853 E Windrose Dr
- 3902 E Corrine Dr
- 12622 N 39th St
- 3907 E Windrose Dr
- 12633 N 38th Place
- 3858 E Windrose Dr
- 12627 N 38th Place
- 3854 E Windrose Dr
- 3848 E Windrose Dr
- 12621 N 38th Place
- 12616 N 39th St
- 3908 E Windrose Dr
- 3916 E Corrine Dr
- 3842 E Windrose Dr
- 3914 E Windrose Dr
- 3919 E Windrose Dr
- 12615 N 38th Place
- 3853 E Aster Dr
- 3901 E Aster Dr
Your Personal Tour Guide
Ask me questions while you tour the home.