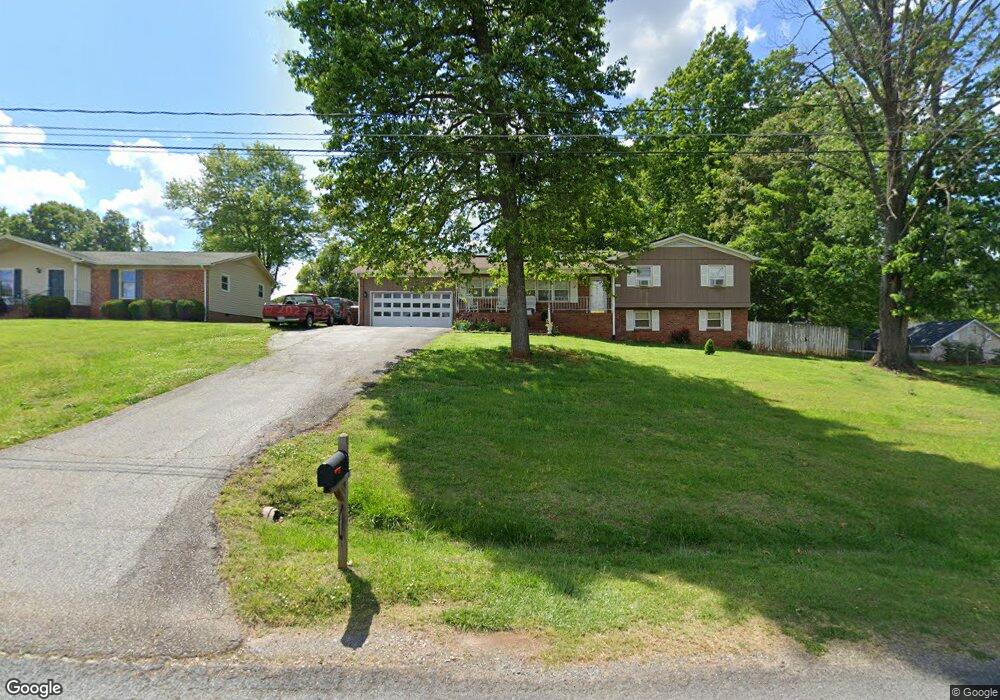
3857 Greenway Dr Trinity, NC 27370
Estimated Value: $257,000 - $278,000
Studio
2
Baths
1,429
Sq Ft
$185/Sq Ft
Est. Value
About This Home
This home is located at 3857 Greenway Dr, Trinity, NC 27370 and is currently estimated at $264,328, approximately $184 per square foot. 3857 Greenway Dr is a home located in Randolph County with nearby schools including Hopewell Elementary School, Wheatmore Middle School, and Wheatmore High School.
Ownership History
Date
Name
Owned For
Owner Type
Purchase Details
Closed on
Jul 15, 2008
Sold by
Kendall Lee and Kendall Eleanor
Bought by
Fowler Randy J and Fowler Crystal L
Current Estimated Value
Home Financials for this Owner
Home Financials are based on the most recent Mortgage that was taken out on this home.
Original Mortgage
$151,620
Outstanding Balance
$97,194
Interest Rate
6.03%
Mortgage Type
FHA
Estimated Equity
$167,134
Purchase Details
Closed on
Oct 18, 2007
Sold by
Federal National Mortgage Association
Bought by
Kendall Lee and Kendall Eleanor
Home Financials for this Owner
Home Financials are based on the most recent Mortgage that was taken out on this home.
Original Mortgage
$79,650
Interest Rate
6.36%
Mortgage Type
Purchase Money Mortgage
Purchase Details
Closed on
May 17, 2007
Sold by
Barnes Shirley H and Barnes Archie
Bought by
Federal National Mortgage Association
Create a Home Valuation Report for This Property
The Home Valuation Report is an in-depth analysis detailing your home's value as well as a comparison with similar homes in the area
Home Values in the Area
Average Home Value in this Area
Purchase History
| Date | Buyer | Sale Price | Title Company |
|---|---|---|---|
| Fowler Randy J | $154,000 | None Available | |
| Kendall Lee | -- | None Available | |
| Federal National Mortgage Association | $110,861 | None Available |
Source: Public Records
Mortgage History
| Date | Status | Borrower | Loan Amount |
|---|---|---|---|
| Open | Fowler Randy J | $151,620 | |
| Previous Owner | Kendall Lee | $79,650 |
Source: Public Records
Tax History
| Year | Tax Paid | Tax Assessment Tax Assessment Total Assessment is a certain percentage of the fair market value that is determined by local assessors to be the total taxable value of land and additions on the property. | Land | Improvement |
|---|---|---|---|---|
| 2025 | $1,423 | $181,280 | $43,810 | $137,470 |
| 2024 | $1,405 | $181,280 | $43,810 | $137,470 |
| 2023 | $1,405 | $181,280 | $43,810 | $137,470 |
| 2022 | $1,087 | $116,680 | $20,070 | $96,610 |
| 2021 | $1,087 | $116,680 | $20,070 | $96,610 |
| 2020 | $1,087 | $116,680 | $20,070 | $96,610 |
| 2019 | $1,087 | $116,680 | $20,070 | $96,610 |
| 2018 | $1,148 | $119,700 | $20,290 | $99,410 |
| 2016 | $1,124 | $119,701 | $20,290 | $99,411 |
| 2015 | $1,127 | $119,701 | $20,290 | $99,411 |
| 2014 | $1,127 | $119,701 | $20,290 | $99,411 |
Source: Public Records
Map
Nearby Homes
- 3856 Azalea Ln
- 5406 Finch Farm Rd
- 6919 Quarter Horse Dr
- 6953 Quarter Horse Dr
- 3954 Evergreen Dr
- 6947 Saddlebred Dr
- 4177 Dawnwood Dr
- 4243 Dawnwood Dr
- Lot 12 Bellawood Dr
- 6265 Lowerywood Cir
- 4567 Red Oak Dr
- 6821 Stone Gables Dr
- 6901 Stone Gables Dr
- 4997 Payne St
- 7307 Lansdowne Place
- 4850 Hopewell Church Rd
- 7435 Trotters Run
- 7356 Belmont Dr
- 4588 Red Oak Dr
- 7449 Old Farm Rd
- 3849 Greenway Dr
- 4107 Lakewood Cir
- 4115 Lakewood Cir
- 3841 Greenway Dr
- 3868 Azalea Ln
- 3854 Greenway Dr
- 3866 Greenway Dr
- 3880 Greenway Dr
- 3836 Azalea Ln
- 3831 Greenway Dr
- 3838 Greenway Dr
- 3826 Azalea Ln
- 00 Azalea
- 3857 Fox Meadow Rd
- 3863 Fox Meadow Rd
- 3821 Greenway Dr
- 3873 Azalea Ln
- 3841 Fox Meadow Rd
- 4017 Lakewood Cir
- 3855 Azalea Ln
Your Personal Tour Guide
Ask me questions while you tour the home.