386 C St Hayward, CA 94541
Burbank NeighborhoodEstimated Value: $984,662 - $1,307,000
5
Beds
3
Baths
1,835
Sq Ft
$611/Sq Ft
Est. Value
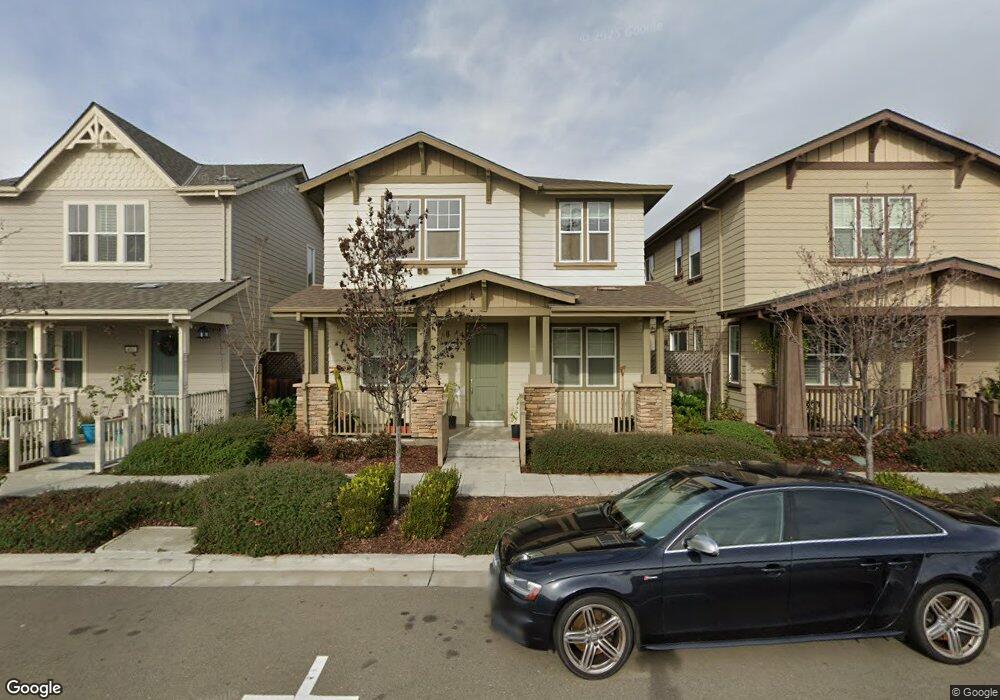
About This Home
This home is located at 386 C St, Hayward, CA 94541 and is currently estimated at $1,120,916, approximately $610 per square foot. 386 C St is a home with nearby schools including Burbank Elementary School, Winton Middle School, and Hayward High School.
Ownership History
Date
Name
Owned For
Owner Type
Purchase Details
Closed on
Dec 9, 2019
Sold by
Chin Johnny Chih Hui and Chao Sharon Chien
Bought by
Chin Johnny Chih Hui and Chao Sharon Chien
Current Estimated Value
Home Financials for this Owner
Home Financials are based on the most recent Mortgage that was taken out on this home.
Original Mortgage
$430,000
Outstanding Balance
$336,938
Interest Rate
3.7%
Mortgage Type
New Conventional
Estimated Equity
$783,978
Purchase Details
Closed on
Aug 12, 2015
Sold by
Haypcr Llc
Bought by
Chin Johnny Chih Hui and Chao Chien Chih
Home Financials for this Owner
Home Financials are based on the most recent Mortgage that was taken out on this home.
Original Mortgage
$507,048
Interest Rate
3.97%
Mortgage Type
New Conventional
Create a Home Valuation Report for This Property
The Home Valuation Report is an in-depth analysis detailing your home's value as well as a comparison with similar homes in the area
Home Values in the Area
Average Home Value in this Area
Purchase History
| Date | Buyer | Sale Price | Title Company |
|---|---|---|---|
| Chin Johnny Chih Hui | -- | Fidelity Natl Ttl Orange Cnt | |
| Chin Johnny Chih Hui | $727,500 | Old Republic Title Company |
Source: Public Records
Mortgage History
| Date | Status | Borrower | Loan Amount |
|---|---|---|---|
| Open | Chin Johnny Chih Hui | $430,000 | |
| Previous Owner | Chin Johnny Chih Hui | $507,048 |
Source: Public Records
Tax History
| Year | Tax Paid | Tax Assessment Tax Assessment Total Assessment is a certain percentage of the fair market value that is determined by local assessors to be the total taxable value of land and additions on the property. | Land | Improvement |
|---|---|---|---|---|
| 2025 | $10,709 | $853,600 | $258,180 | $602,420 |
| 2024 | $10,709 | $836,726 | $253,118 | $590,608 |
| 2023 | $10,554 | $827,187 | $248,156 | $579,031 |
| 2022 | $10,354 | $803,967 | $243,290 | $567,677 |
| 2021 | $10,272 | $788,068 | $238,520 | $556,548 |
| 2020 | $10,161 | $786,918 | $236,075 | $550,843 |
| 2019 | $10,241 | $771,491 | $231,447 | $540,044 |
| 2018 | $9,624 | $756,370 | $226,911 | $529,459 |
| 2017 | $9,407 | $741,540 | $222,462 | $519,078 |
| 2016 | $6,409 | $511,221 | $68,721 | $442,500 |
| 2015 | $844 | $67,689 | $67,689 | $0 |
Source: Public Records
Map
Nearby Homes
- 522 B St
- 204 Sullivan Way
- 589 Staley Ave
- 22964 Alice St
- 568 Dean St
- 537 Dean St
- 622 Moss Way
- 22575 Amador St
- 257 Poplar Ave
- 710 City Walk Place Unit 3
- 710 City Walk Place Unit 4
- 728 City Walk Place Unit 4
- 22876 Charing St
- 742 B St
- 22716 Atherton St Unit 30
- 22894 Kingsford Way
- 22168 Peralta St
- 22133 Peralta St
- 24023 Edloe Dr
- 19895 Mission Blvd
Your Personal Tour Guide
Ask me questions while you tour the home.