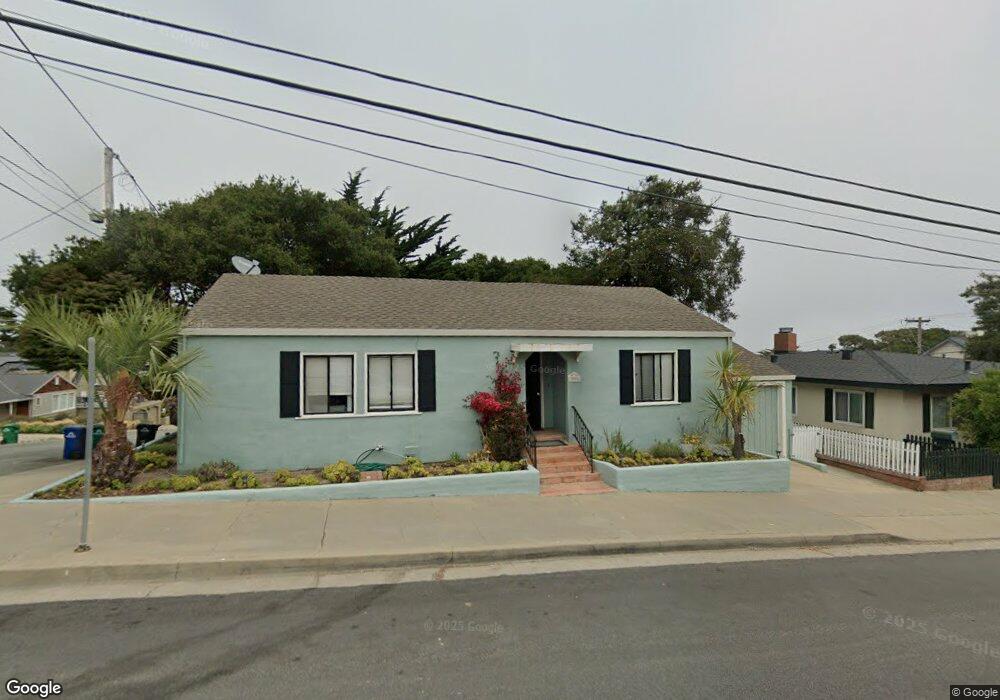
386 Laurel Ave Pacific Grove, CA 93950
Estimated Value: $1,016,000 - $1,291,000
3
Beds
2
Baths
1,169
Sq Ft
$983/Sq Ft
Est. Value
About This Home
This home is located at 386 Laurel Ave, Pacific Grove, CA 93950 and is currently estimated at $1,148,771, approximately $982 per square foot. 386 Laurel Ave is a home located in Monterey County with nearby schools including Robert Down Elementary School, Pacific Grove Middle School, and Pacific Grove High School.
Ownership History
Date
Name
Owned For
Owner Type
Purchase Details
Closed on
Jun 25, 2024
Sold by
Maurice And Adelaide Agostini Trust and Moser Maureen A
Bought by
Moser Maureen A and Agostini Ronald A
Current Estimated Value
Purchase Details
Closed on
Mar 29, 2023
Sold by
Franceschetti Mark
Bought by
Mark Franceschetti And Sherri Franceschetti L
Purchase Details
Closed on
Aug 31, 2022
Sold by
Franceschetti-Victorino Jill
Bought by
Jill Franceschetti Victorino 2022 Revocable L
Purchase Details
Closed on
Mar 26, 2021
Sold by
Franceschetti Robert
Bought by
Franceschetti Robert and Robert Franceschetti Trust
Purchase Details
Closed on
Sep 14, 2016
Sold by
Franceschetti Robert and Franceschetti Freda Charleen
Bought by
Franceschetti Robert and Franceschetti Freda Charleen
Create a Home Valuation Report for This Property
The Home Valuation Report is an in-depth analysis detailing your home's value as well as a comparison with similar homes in the area
Home Values in the Area
Average Home Value in this Area
Purchase History
| Date | Buyer | Sale Price | Title Company |
|---|---|---|---|
| Moser Maureen A | -- | None Listed On Document | |
| Mark Franceschetti And Sherri Franceschetti L | -- | None Listed On Document | |
| Jill Franceschetti Victorino 2022 Revocable L | -- | -- | |
| Franceschetti Robert | -- | None Available | |
| Franceschetti Mark | -- | None Available | |
| Franceschetti Robert | -- | None Available | |
| Franceschetti Robert | -- | None Available |
Source: Public Records
Tax History
| Year | Tax Paid | Tax Assessment Tax Assessment Total Assessment is a certain percentage of the fair market value that is determined by local assessors to be the total taxable value of land and additions on the property. | Land | Improvement |
|---|---|---|---|---|
| 2025 | $2,532 | $568,489 | $325,885 | $242,604 |
| 2024 | $2,532 | $557,344 | $319,496 | $237,848 |
| 2023 | $2,590 | $229,626 | $119,848 | $109,778 |
| 2022 | $2,538 | $225,125 | $117,499 | $107,626 |
| 2021 | $2,525 | $220,712 | $115,196 | $105,516 |
| 2020 | $2,475 | $218,450 | $114,015 | $104,435 |
| 2019 | $2,398 | $214,168 | $111,780 | $102,388 |
| 2018 | $2,352 | $209,970 | $109,589 | $100,381 |
| 2017 | $2,314 | $205,854 | $107,441 | $98,413 |
| 2016 | $2,647 | $201,819 | $105,335 | $96,484 |
| 2015 | $2,393 | $198,788 | $103,753 | $95,035 |
| 2014 | $2,343 | $194,895 | $101,721 | $93,174 |
Source: Public Records
Map
Nearby Homes
- 160 Monterey Ave
- 229 7th St
- 301 7th St
- 131 7th St
- 410 Pine Ave
- 136 2nd St
- 520 Lighthouse Ave Unit 301
- 514 6th St
- 515 13th St
- 115 1st St
- 224 16th St
- 132 Forest Ave
- 127 16th St
- 824 Archer St
- 618 Forest Ave
- 883 Lighthouse Ave
- 302 Park St
- 700 Briggs Ave Unit 77
- 700 Briggs Ave Unit 83
- 700 Briggs Ave Unit 84
Your Personal Tour Guide
Ask me questions while you tour the home.