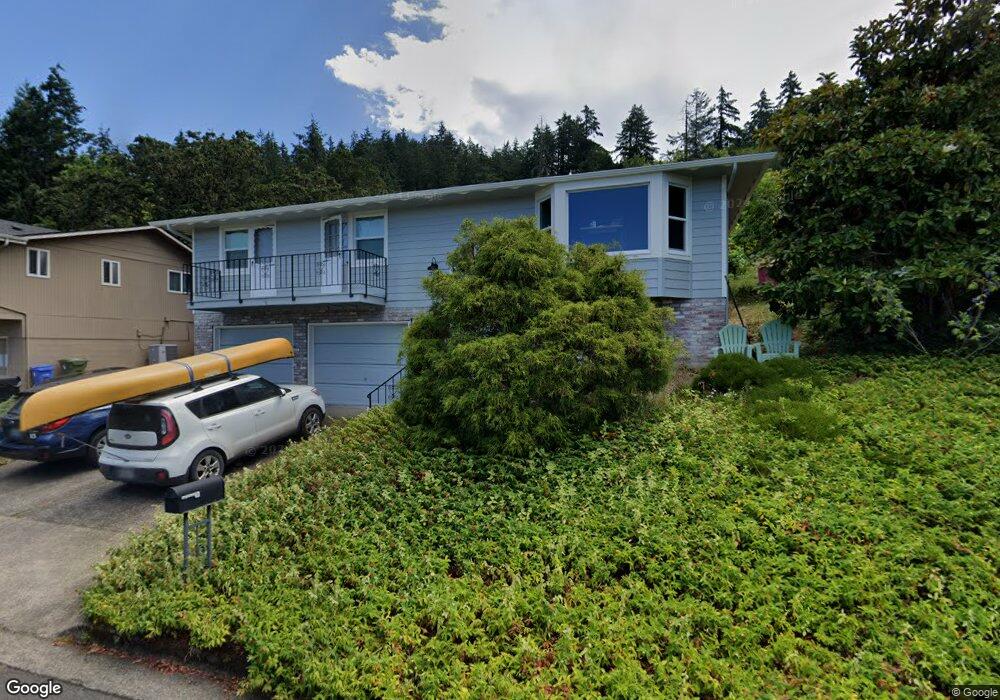
3863 Onyx St Eugene, OR 97405
Southeast Eugene NeighborhoodEstimated Value: $525,674 - $595,000
3
Beds
3
Baths
1,712
Sq Ft
$327/Sq Ft
Est. Value
About This Home
This home is located at 3863 Onyx St, Eugene, OR 97405 and is currently estimated at $559,169, approximately $326 per square foot. 3863 Onyx St is a home located in Lane County with nearby schools including Camas Ridge Community Elementary School, Spencer Butte Middle School, and South Eugene High School.
Ownership History
Date
Name
Owned For
Owner Type
Purchase Details
Closed on
Jun 10, 2013
Sold by
Paskalev Ivan P and Gulemotova Maria K
Bought by
Henry Dave L and Farina Theresa A
Current Estimated Value
Purchase Details
Closed on
Jan 27, 2009
Sold by
Moulton Marc Gorham
Bought by
Paskalev Ivan P and Gulemetova Maria K
Home Financials for this Owner
Home Financials are based on the most recent Mortgage that was taken out on this home.
Original Mortgage
$263,150
Interest Rate
4.92%
Mortgage Type
Purchase Money Mortgage
Purchase Details
Closed on
Feb 11, 1998
Sold by
Etal Sandstrom J Henry Te and Sandstrom Susan
Bought by
Moulton Marc Gorham
Home Financials for this Owner
Home Financials are based on the most recent Mortgage that was taken out on this home.
Original Mortgage
$131,600
Interest Rate
6.98%
Create a Home Valuation Report for This Property
The Home Valuation Report is an in-depth analysis detailing your home's value as well as a comparison with similar homes in the area
Home Values in the Area
Average Home Value in this Area
Purchase History
| Date | Buyer | Sale Price | Title Company |
|---|---|---|---|
| Henry Dave L | $283,500 | Fidelity National Title Insu | |
| Paskalev Ivan P | $277,000 | Fidelity National Title Insu | |
| Moulton Marc Gorham | $164,500 | Evergreen Land Title Co |
Source: Public Records
Mortgage History
| Date | Status | Borrower | Loan Amount |
|---|---|---|---|
| Previous Owner | Paskalev Ivan P | $263,150 | |
| Previous Owner | Moulton Marc Gorham | $131,600 |
Source: Public Records
Tax History
| Year | Tax Paid | Tax Assessment Tax Assessment Total Assessment is a certain percentage of the fair market value that is determined by local assessors to be the total taxable value of land and additions on the property. | Land | Improvement |
|---|---|---|---|---|
| 2025 | $5,478 | $281,147 | -- | -- |
| 2024 | $5,410 | $272,959 | -- | -- |
| 2023 | $5,410 | $265,009 | $0 | $0 |
| 2022 | $5,068 | $257,291 | $0 | $0 |
| 2021 | $4,760 | $249,798 | $0 | $0 |
| 2020 | $4,777 | $242,523 | $0 | $0 |
| 2019 | $4,613 | $235,460 | $0 | $0 |
| 2018 | $4,343 | $221,944 | $0 | $0 |
| 2017 | $4,148 | $221,944 | $0 | $0 |
| 2016 | $3,986 | $215,480 | $0 | $0 |
| 2015 | $3,869 | $209,204 | $0 | $0 |
| 2014 | $3,809 | $203,111 | $0 | $0 |
Source: Public Records
Map
Nearby Homes
- 1210 E 38th Ave
- 3790 Onyx St
- 0 N Shasta Loop Unit 384285834
- 1180 E 37th Ave
- 3817 E Amazon Dr
- 4835 Elva Ln
- 3605 Emerald St
- 910 E 43rd Ave
- 4320 Fox Hollow Rd
- 0 Wendell Ln Unit 200453475
- 0 Wendell Ln Unit 279865930
- 0 Wendell Ln Unit 1
- 1755 E 43rd Ave
- 4364 Fox Hollow Rd
- 3945 Spring Blvd
- 4015 Spring Knoll Dr
- 1865 E 43rd Ave
- 3283 Stoney Ridge Rd
- 4429 Fox Hollow Rd Unit 3
- 1862 E 43rd Ave
Your Personal Tour Guide
Ask me questions while you tour the home.