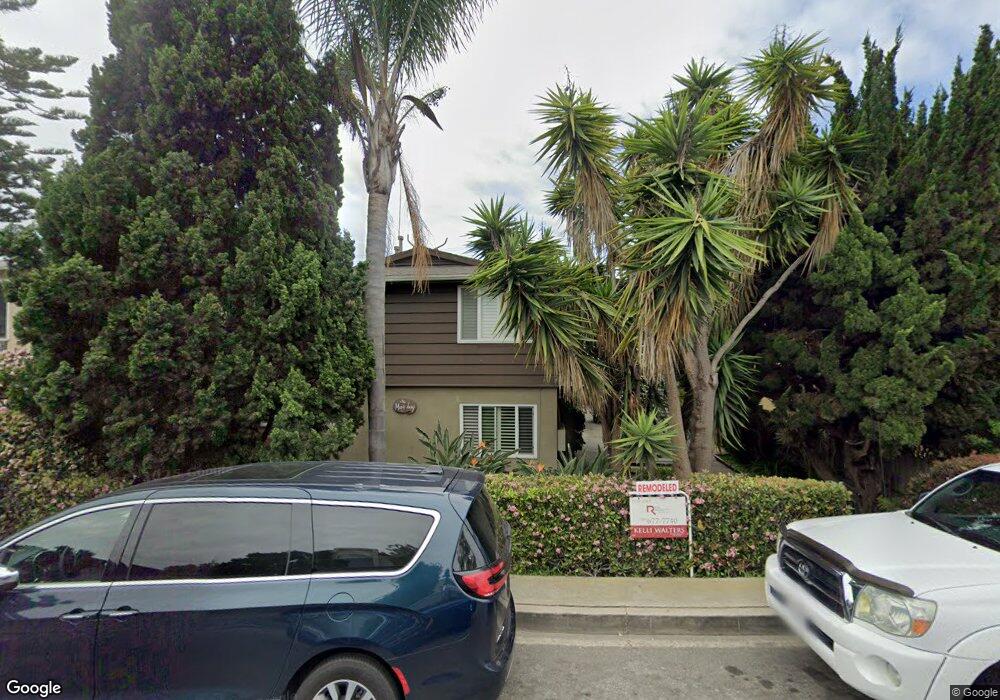
387 Cypress Dr Unit 1 Laguna Beach, CA 92651
North Laguna NeighborhoodEstimated Value: $900,000 - $2,098,000
1
Bed
1
Bath
456
Sq Ft
$2,986/Sq Ft
Est. Value
About This Home
This home is located at 387 Cypress Dr Unit 1, Laguna Beach, CA 92651 and is currently estimated at $1,361,449, approximately $2,985 per square foot. 387 Cypress Dr Unit 1 is a home located in Orange County with nearby schools including El Morro Elementary School, Thurston Middle School, and Laguna Beach High School.
Ownership History
Date
Name
Owned For
Owner Type
Purchase Details
Closed on
Jun 17, 2021
Sold by
Smith Stephanie A
Bought by
Smith Stephanie A and S Smith 2014 Trust
Current Estimated Value
Home Financials for this Owner
Home Financials are based on the most recent Mortgage that was taken out on this home.
Original Mortgage
$366,000
Outstanding Balance
$277,889
Interest Rate
2.9%
Mortgage Type
New Conventional
Estimated Equity
$1,083,560
Purchase Details
Closed on
Apr 21, 2021
Sold by
Smith James Allin
Bought by
Smith Stephanis An and The S Smith 2014 Trust
Home Financials for this Owner
Home Financials are based on the most recent Mortgage that was taken out on this home.
Original Mortgage
$366,000
Outstanding Balance
$277,889
Interest Rate
2.9%
Mortgage Type
New Conventional
Estimated Equity
$1,083,560
Purchase Details
Closed on
May 28, 2020
Sold by
Smith Stephanie Ann and Smith James Allin
Bought by
Smith Stephanie A and Smith James Allin
Home Financials for this Owner
Home Financials are based on the most recent Mortgage that was taken out on this home.
Original Mortgage
$374,321
Interest Rate
3.2%
Mortgage Type
New Conventional
Purchase Details
Closed on
Jan 2, 2020
Sold by
Smith Stephanie A
Bought by
Smith Stephanie A and Smith James Allen
Purchase Details
Closed on
Aug 11, 2016
Sold by
Smith Stephanie A
Bought by
Smith Stephanie A and S Smith 2014 Trust
Home Financials for this Owner
Home Financials are based on the most recent Mortgage that was taken out on this home.
Original Mortgage
$417,000
Interest Rate
3.41%
Mortgage Type
New Conventional
Purchase Details
Closed on
Jul 8, 2014
Sold by
Smith Stephanie A
Bought by
Smith Stephanie A and The S Smith 2014 Trust
Purchase Details
Closed on
Apr 29, 2004
Sold by
Perovich Veris Loreta
Bought by
Smith Stephanie A
Home Financials for this Owner
Home Financials are based on the most recent Mortgage that was taken out on this home.
Original Mortgage
$293,600
Interest Rate
5.37%
Mortgage Type
Purchase Money Mortgage
Purchase Details
Closed on
Nov 19, 1998
Sold by
Helene Winnegrad
Bought by
Perovich Veris Loreta
Home Financials for this Owner
Home Financials are based on the most recent Mortgage that was taken out on this home.
Original Mortgage
$129,050
Interest Rate
6.77%
Purchase Details
Closed on
Feb 22, 1992
Sold by
Winnegrad Helene and Snyder Phyllis M
Bought by
Winnegrad Helene and Snyder Phyllis M
Create a Home Valuation Report for This Property
The Home Valuation Report is an in-depth analysis detailing your home's value as well as a comparison with similar homes in the area
Home Values in the Area
Average Home Value in this Area
Purchase History
| Date | Buyer | Sale Price | Title Company |
|---|---|---|---|
| Smith Stephanie A | -- | Title Connect | |
| Smith Stephanie A | -- | Title Connect | |
| Smith Stephanis An | -- | Nextitle | |
| Smith Stephanie A | -- | Title Connect Inc | |
| Smith Stephanie Ann | -- | Title Connect Inc | |
| Smith Stephanie A | -- | None Available | |
| Smith Stephanie A | -- | Nextitle | |
| Smith Stephanie A | -- | Nextitle | |
| Smith Stephanie A | -- | None Available | |
| Smith Stephanie A | $367,000 | Commerce Title | |
| Perovich Veris Loreta | $145,000 | Commonwealth Land Title | |
| Winnegrad Helene | -- | Commonwealth Land Title |
Source: Public Records
Mortgage History
| Date | Status | Borrower | Loan Amount |
|---|---|---|---|
| Open | Smith Stephanie A | $366,000 | |
| Closed | Smith Stephanie Ann | $374,321 | |
| Closed | Smith Stephanie A | $417,000 | |
| Closed | Smith Stephanie A | $293,600 | |
| Previous Owner | Perovich Veris Loreta | $129,050 | |
| Closed | Smith Stephanie A | $73,400 |
Source: Public Records
Tax History Compared to Growth
Tax History
| Year | Tax Paid | Tax Assessment Tax Assessment Total Assessment is a certain percentage of the fair market value that is determined by local assessors to be the total taxable value of land and additions on the property. | Land | Improvement |
|---|---|---|---|---|
| 2025 | $6,092 | $521,787 | $490,460 | $31,327 |
| 2024 | $6,092 | $511,556 | $480,843 | $30,713 |
| 2023 | $5,919 | $501,526 | $471,415 | $30,111 |
| 2022 | $5,773 | $491,693 | $462,172 | $29,521 |
| 2021 | $6,957 | $613,063 | $588,996 | $24,067 |
| 2020 | $5,605 | $477,110 | $448,463 | $28,647 |
| 2019 | $5,486 | $467,755 | $439,669 | $28,086 |
| 2018 | $5,366 | $458,584 | $431,048 | $27,536 |
| 2017 | $5,243 | $449,593 | $422,596 | $26,997 |
| 2016 | $5,127 | $440,778 | $414,310 | $26,468 |
| 2015 | $5,032 | $434,158 | $408,087 | $26,071 |
| 2014 | $4,850 | $425,654 | $400,093 | $25,561 |
Source: Public Records
Map
Nearby Homes
- 387 Cypress Dr Unit 7
- 432 N Coast Hwy
- 422 Cypress Dr
- 428 Cypress Dr Unit 428
- 438 Cypress Dr Unit 3
- 432 Holly St
- 520 Cliff Dr Unit 304
- 310 Hawthorne Rd
- 234 Cliff Dr Unit 4
- 625 High Dr
- 535 High Dr
- 482 High Dr
- 522 High Dr
- 530 High Dr
- 455 Bonvue Terrace
- 716 Cliff Dr
- 738 Cliff Dr
- 205 High Dr
- 22691 Allview Terrace
- 336 Lookout Dr
- 387 Cypress Dr Unit 3
- 387 Cypress Dr Unit 2
- 387 Cypress Dr Unit 9
- 387 Cypress Dr Unit 4
- 387 Cypress Dr
- 387 Cypress Dr Unit 8
- 387 Cypress Dr Unit 5
- 387 Cypress Dr
- 387 Cypress Dr Unit 6
- 379 Cypress Dr Unit 6
- 379 Cypress Dr Unit 4
- 379 Cypress Dr Unit 1
- 379 Cypress Dr Unit 2
- 379 Cypress Dr Unit 5
- 379 Cypress Dr
- 287 Jasmine St Unit 4
- 287 Jasmine St Unit 2
- 287 Jasmine St
- 287 Jasmine St Unit 5
- 287 Jasmine St Unit 1