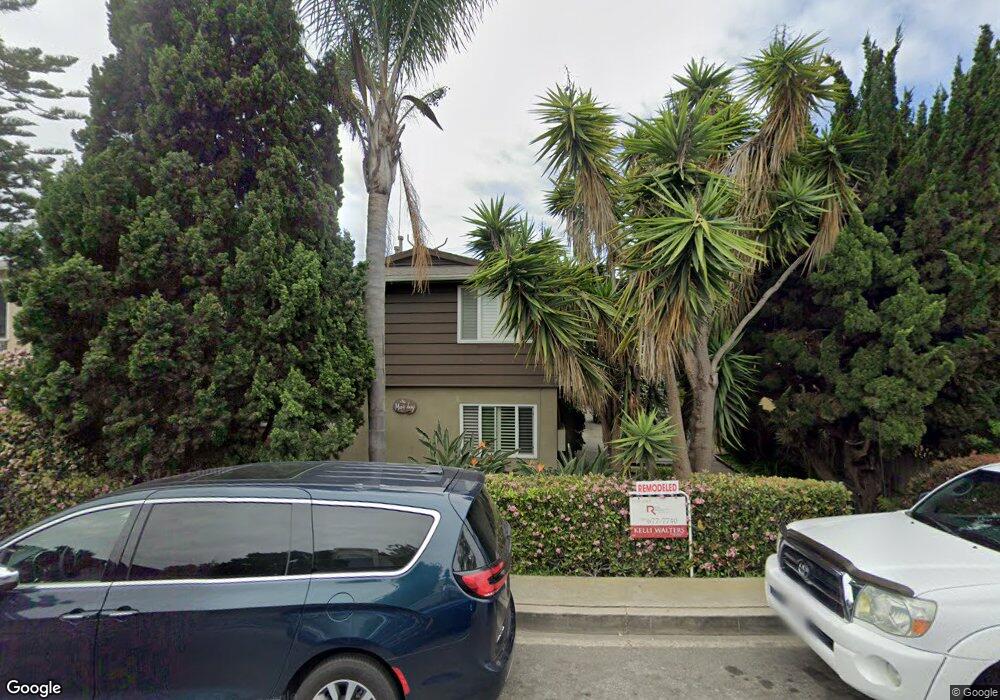
387 Cypress Dr Unit 5 Laguna Beach, CA 92651
North Laguna NeighborhoodEstimated Value: $869,000 - $2,333,000
1
Bed
1
Bath
500
Sq Ft
$2,930/Sq Ft
Est. Value
About This Home
This home is located at 387 Cypress Dr Unit 5, Laguna Beach, CA 92651 and is currently estimated at $1,465,095, approximately $2,930 per square foot. 387 Cypress Dr Unit 5 is a home located in Orange County with nearby schools including El Morro Elementary School, Thurston Middle School, and Laguna Beach High School.
Ownership History
Date
Name
Owned For
Owner Type
Purchase Details
Closed on
Dec 27, 2024
Sold by
Burgeson Anne and Burgeson Anne Anne
Bought by
Burgeson Anne
Current Estimated Value
Purchase Details
Closed on
Jun 17, 2022
Sold by
Anne Burgeson Declaration Of Trust
Bought by
Burgeson Anne
Home Financials for this Owner
Home Financials are based on the most recent Mortgage that was taken out on this home.
Original Mortgage
$257,000
Interest Rate
5.25%
Mortgage Type
New Conventional
Purchase Details
Closed on
Aug 4, 2016
Sold by
Burgeson Anne
Bought by
Burgeson Anne and Anne Burgeson Declaration Of Trust
Purchase Details
Closed on
May 21, 2009
Sold by
Swan Philip V
Bought by
Burgeson Anne C
Purchase Details
Closed on
Aug 13, 1998
Sold by
Thompson Patricia M
Bought by
Burgeson Marjorie T and Trust B Of Earl B & Marjorie T Burgeson
Create a Home Valuation Report for This Property
The Home Valuation Report is an in-depth analysis detailing your home's value as well as a comparison with similar homes in the area
Home Values in the Area
Average Home Value in this Area
Purchase History
| Date | Buyer | Sale Price | Title Company |
|---|---|---|---|
| Burgeson Anne | -- | Fidelity National Title | |
| Burgeson Anne | -- | Fidelity National Title | |
| Burgeson Anne | -- | Premium Title | |
| Burgeson Anne | -- | None Available | |
| Burgeson Anne C | -- | None Available | |
| Burgeson Marjorie T | $148,000 | Chicago Title Co |
Source: Public Records
Mortgage History
| Date | Status | Borrower | Loan Amount |
|---|---|---|---|
| Previous Owner | Burgeson Anne | $257,000 |
Source: Public Records
Tax History Compared to Growth
Tax History
| Year | Tax Paid | Tax Assessment Tax Assessment Total Assessment is a certain percentage of the fair market value that is determined by local assessors to be the total taxable value of land and additions on the property. | Land | Improvement |
|---|---|---|---|---|
| 2025 | $3,274 | $231,698 | $199,164 | $32,534 |
| 2024 | $3,274 | $227,155 | $195,258 | $31,897 |
| 2023 | $3,167 | $222,701 | $191,429 | $31,272 |
| 2022 | $3,074 | $218,335 | $187,676 | $30,659 |
| 2021 | $2,984 | $214,054 | $183,996 | $30,058 |
| 2020 | $2,916 | $211,860 | $182,110 | $29,750 |
| 2019 | $2,844 | $207,706 | $178,539 | $29,167 |
| 2018 | $2,774 | $203,634 | $175,038 | $28,596 |
| 2017 | $2,702 | $199,642 | $171,606 | $28,036 |
| 2016 | $2,634 | $195,728 | $168,241 | $27,487 |
| 2015 | $2,576 | $192,788 | $165,713 | $27,075 |
| 2014 | $2,512 | $189,012 | $162,467 | $26,545 |
Source: Public Records
Map
Nearby Homes
- 387 Cypress Dr Unit 7
- 432 N Coast Hwy
- 422 Cypress Dr
- 428 Cypress Dr Unit 428
- 438 Cypress Dr Unit 3
- 255 Cypress Dr Unit 2
- 432 Holly St
- 520 Cliff Dr Unit 304
- 234 Cliff Dr Unit 4
- 310 Hawthorne Rd
- 421 High Dr
- 625 High Dr
- 535 High Dr
- 482 High Dr
- 522 High Dr
- 530 High Dr
- 455 Bonvue Terrace
- 716 Cliff Dr
- 738 Cliff Dr
- 205 High Dr
- 387 Cypress Dr Unit 3
- 387 Cypress Dr Unit 2
- 387 Cypress Dr Unit 9
- 387 Cypress Dr Unit 1
- 387 Cypress Dr Unit 4
- 387 Cypress Dr
- 387 Cypress Dr Unit 8
- 387 Cypress Dr
- 387 Cypress Dr Unit 6
- 379 Cypress Dr Unit 6
- 379 Cypress Dr Unit 4
- 379 Cypress Dr Unit 1
- 379 Cypress Dr Unit 2
- 379 Cypress Dr Unit 5
- 379 Cypress Dr
- 287 Jasmine St Unit 4
- 287 Jasmine St Unit 2
- 287 Jasmine St
- 287 Jasmine St Unit 5
- 287 Jasmine St Unit 1