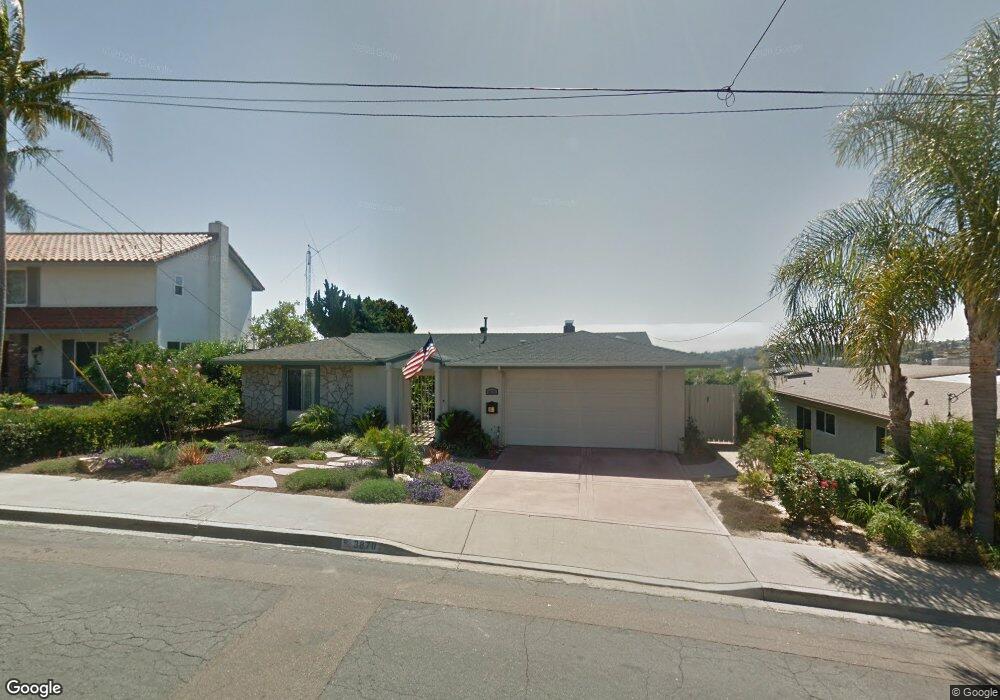
3870 Cadden Way San Diego, CA 92117
Bay Ho NeighborhoodEstimated Value: $1,562,649 - $1,935,000
4
Beds
2
Baths
2,248
Sq Ft
$787/Sq Ft
Est. Value
About This Home
This home is located at 3870 Cadden Way, San Diego, CA 92117 and is currently estimated at $1,768,412, approximately $786 per square foot. 3870 Cadden Way is a home located in San Diego County with nearby schools including Cadman Elementary School, Marston Middle School, and Clairemont High School.
Ownership History
Date
Name
Owned For
Owner Type
Purchase Details
Closed on
Feb 27, 2004
Sold by
Ellis Richard Hoff and Ellis Barbara Jean
Bought by
Ellis Richard H and Ellis Barbara J
Current Estimated Value
Purchase Details
Closed on
Jan 30, 2001
Sold by
Ellis Richard H and Ellis Barbara J
Bought by
Ellis Richard H and Ellis Barbara J
Purchase Details
Closed on
Jan 17, 2001
Sold by
Ellis Richard H and Ellis Barbara J
Bought by
Ellis Richard H and Ellis Barbara J
Purchase Details
Closed on
Jul 6, 2000
Sold by
Ellis Richard H and Ellis Barbara J
Bought by
Ellis Richard H and Ellis Barbara J
Create a Home Valuation Report for This Property
The Home Valuation Report is an in-depth analysis detailing your home's value as well as a comparison with similar homes in the area
Home Values in the Area
Average Home Value in this Area
Purchase History
| Date | Buyer | Sale Price | Title Company |
|---|---|---|---|
| Ellis Richard H | -- | -- | |
| Ellis Richard H | -- | United Title Company | |
| Ellis Richard H | -- | United Title Company | |
| Ellis Richard H | -- | -- |
Source: Public Records
Tax History Compared to Growth
Tax History
| Year | Tax Paid | Tax Assessment Tax Assessment Total Assessment is a certain percentage of the fair market value that is determined by local assessors to be the total taxable value of land and additions on the property. | Land | Improvement |
|---|---|---|---|---|
| 2025 | $1,540 | $132,107 | $43,865 | $88,242 |
| 2024 | $1,540 | $129,517 | $43,005 | $86,512 |
| 2023 | $1,503 | $126,978 | $42,162 | $84,816 |
| 2022 | $1,462 | $124,489 | $41,336 | $83,153 |
| 2021 | $1,450 | $122,049 | $40,526 | $81,523 |
| 2020 | $1,432 | $120,799 | $40,111 | $80,688 |
| 2019 | $1,406 | $118,431 | $39,325 | $79,106 |
| 2018 | $1,314 | $116,109 | $38,554 | $77,555 |
| 2017 | $80 | $113,834 | $37,799 | $76,035 |
| 2016 | $1,258 | $111,603 | $37,058 | $74,545 |
| 2015 | $1,238 | $109,928 | $36,502 | $73,426 |
| 2014 | -- | $107,775 | $35,787 | $71,988 |
Source: Public Records
Map
Nearby Homes
- 3903 Cadden Way
- 4010 Paducah Dr
- 3212 Cadden Ct
- 3341 Cadden Dr
- 4048 Raffee Dr
- 4060 Huerfano Ave Unit 146
- 4060 Huerfano Ave Unit 130
- 4060 Huerfano Ave Unit 125
- 4060 Huerfano Ave Unit 240
- 4060 Huerfano Ave Unit 126
- 3535 Monair Dr Unit D
- 3360 Mount Laurence Dr
- 4135 Huerfano Ave
- 3719 Balboa Terrace Unit A
- 3675 Paul Jones Ave
- 4150 Taos Dr
- 3539 Mount Laurence Dr
- 2609 Pico Place Unit 127
- 3640 Princeton Ave
- 4647 Pico St Unit 205
- 3860 Cadden Way
- 3906 Cadden Way
- 3850 Cadden Way
- 3916 Cadden Way
- 3840 Cadden Way
- 3855 Cadden Way
- 3926 Cadden Way
- 3913 Cadden Way
- 3845 Cadden Way
- 3830 Cadden Way
- 3923 Cadden Way
- 3936 Cadden Way
- 3835 Cadde Way
- 3835 Cadden Way
- 3933 Cadden Way
- 3820 Cadden Way
- 3825 Cadden Way
- 3946 Cadden Way
- 3943 Cadden Way
- 3810 Cadden Way