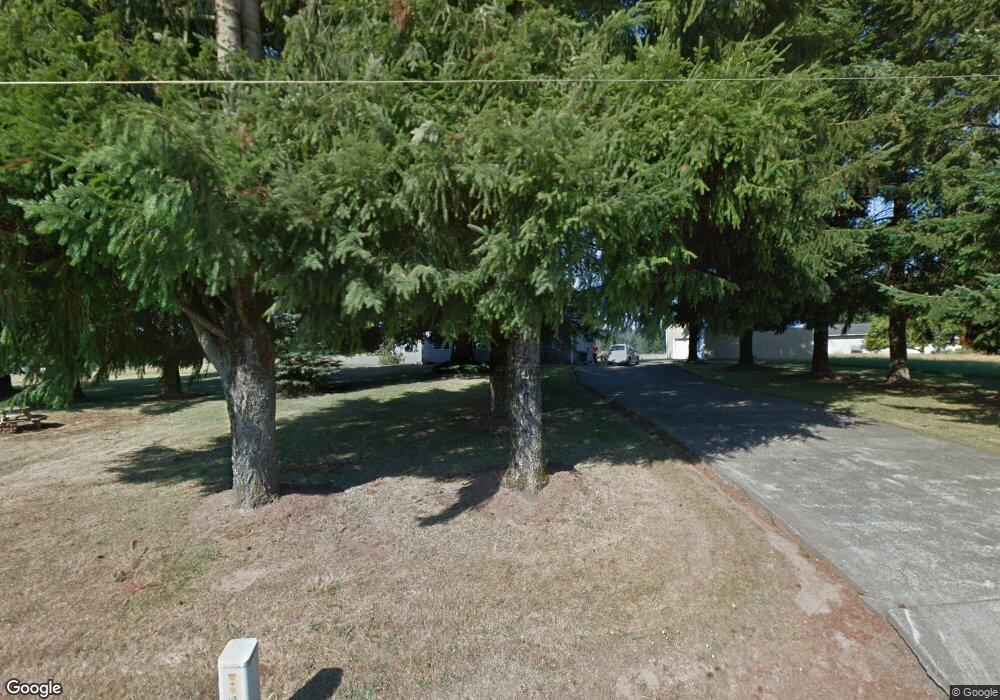
38704 NW 9th Ave La Center, WA 98629
Estimated Value: $618,634 - $770,000
3
Beds
3
Baths
1,433
Sq Ft
$488/Sq Ft
Est. Value
About This Home
This home is located at 38704 NW 9th Ave, La Center, WA 98629 and is currently estimated at $699,409, approximately $488 per square foot. 38704 NW 9th Ave is a home located in Clark County with nearby schools including La Center Elementary School, La Center Middle School, and La Center High School.
Ownership History
Date
Name
Owned For
Owner Type
Purchase Details
Closed on
Mar 20, 2025
Sold by
Holmes David and Holmes Terresa
Bought by
Chamberlin Brandon C and Chamberlin Janelle R
Current Estimated Value
Home Financials for this Owner
Home Financials are based on the most recent Mortgage that was taken out on this home.
Original Mortgage
$705,977
Outstanding Balance
$702,378
Interest Rate
6.89%
Mortgage Type
FHA
Estimated Equity
-$2,969
Purchase Details
Closed on
Dec 3, 2019
Sold by
Hebblethwaite Helen M
Bought by
Holmes David and Holmes Terresa
Purchase Details
Closed on
Apr 20, 1999
Sold by
Saum Patricia L and Mchargue Kathryn M
Bought by
Hebblethwaite Helen M
Home Financials for this Owner
Home Financials are based on the most recent Mortgage that was taken out on this home.
Original Mortgage
$20,000
Interest Rate
7.1%
Create a Home Valuation Report for This Property
The Home Valuation Report is an in-depth analysis detailing your home's value as well as a comparison with similar homes in the area
Home Values in the Area
Average Home Value in this Area
Purchase History
| Date | Buyer | Sale Price | Title Company |
|---|---|---|---|
| Chamberlin Brandon C | $719,000 | Wfg National Title | |
| Holmes David | $375,000 | Fidelity Natl Ttl Vancouver | |
| Hebblethwaite Helen M | -- | Charter Title Corporation |
Source: Public Records
Mortgage History
| Date | Status | Borrower | Loan Amount |
|---|---|---|---|
| Open | Chamberlin Brandon C | $705,977 | |
| Previous Owner | Hebblethwaite Helen M | $20,000 |
Source: Public Records
Tax History Compared to Growth
Tax History
| Year | Tax Paid | Tax Assessment Tax Assessment Total Assessment is a certain percentage of the fair market value that is determined by local assessors to be the total taxable value of land and additions on the property. | Land | Improvement |
|---|---|---|---|---|
| 2025 | $5,087 | $551,877 | $286,564 | $265,313 |
| 2024 | $4,932 | $529,608 | $286,564 | $243,044 |
| 2023 | $4,710 | $538,145 | $291,800 | $246,345 |
| 2022 | $4,547 | $496,687 | $266,242 | $230,445 |
| 2021 | $4,250 | $425,881 | $218,993 | $206,888 |
| 2020 | $3,996 | $373,401 | $193,007 | $180,394 |
| 2019 | $1,835 | $356,937 | $181,195 | $175,742 |
| 2018 | $3,738 | $360,040 | $0 | $0 |
| 2017 | $2,989 | $325,210 | $0 | $0 |
| 2016 | $2,867 | $296,758 | $0 | $0 |
| 2015 | $2,914 | $263,865 | $0 | $0 |
| 2014 | -- | $254,523 | $0 | $0 |
| 2013 | -- | $228,117 | $0 | $0 |
Source: Public Records
Map
Nearby Homes
- 116 NW 394th St
- 1109 NE 389th St
- 40920 NW Maple Ridge Rd
- 1800 NW Lyons Rd
- 818 NW 359th St
- 35706 NW 14th Ave
- 34719 NW Pacific Hwy
- 35224 NW 32nd Ave
- 516 W 20th Way
- 510 W 20th Way
- 149 W 20th Way
- 410 W 20th Way
- 404 W 20th Way
- 143 W 20th Way
- 310 W 20th Way
- 403 W 19th St
- 2817 NW Eddy Rock Rd
- Silverton Plan at Stephens Hillside Farm
- Baker Plan at Stephens Hillside Farm
- Cashmere Plan at Stephens Hillside Farm
- 1013 NW 389th St
- 1121 NW 389th St
- 1112 NW 384th Cir
- 1216 NW 384th Cir
- 603 NW 389th St
- 1307 NW 389th St
- 1300 NW 384th Cir
- 38219 NW 9th Ave
- 38706 NW 14th Ave
- 1201 NW 384th Cir
- 501 NW 389th St
- 38500 NW 14th Ave
- 1111 NW 384th Cir
- 1303 NW 384th Cir
- 600 NW 389th St
- 1507 NW 389th St
- 706 NW 381st St
- 39220 NW 4th Ave
- 38709 NW 4th Ave
- 1703 NW 389th St