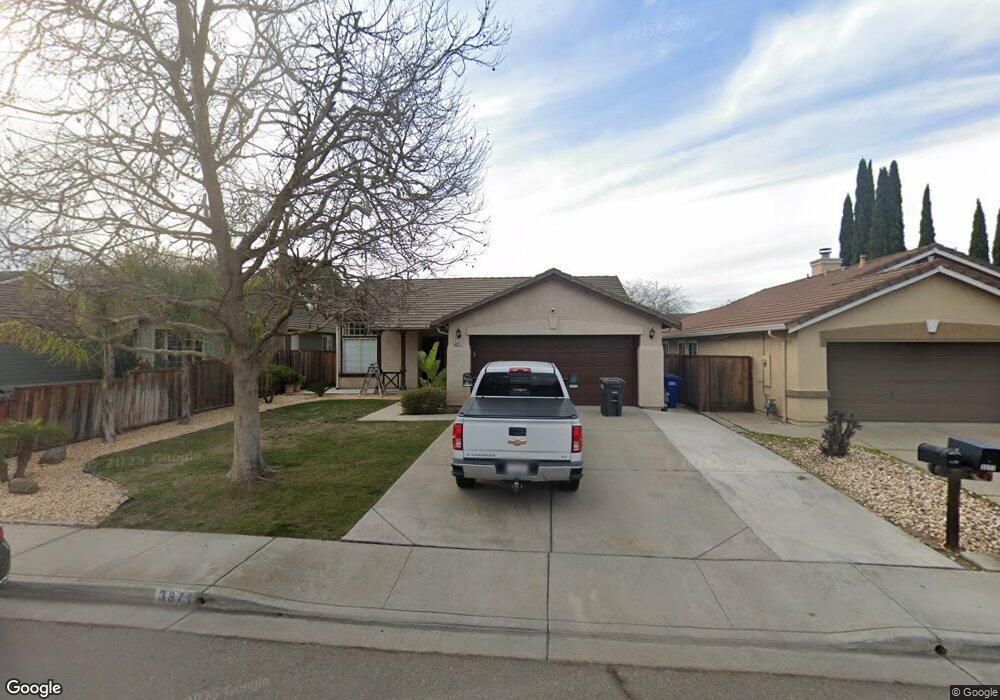
3871 Marsh Way Oakley, CA 94561
South Oakley NeighborhoodEstimated Value: $552,569 - $649,000
3
Beds
2
Baths
1,325
Sq Ft
$447/Sq Ft
Est. Value
About This Home
This home is located at 3871 Marsh Way, Oakley, CA 94561 and is currently estimated at $592,392, approximately $447 per square foot. 3871 Marsh Way is a home located in Contra Costa County with nearby schools including Gehringer Elementary School, O'Hara Park Middle School, and Freedom High School.
Ownership History
Date
Name
Owned For
Owner Type
Purchase Details
Closed on
Jan 16, 2014
Sold by
Capital Equity Management Group Inc
Bought by
Amaral Michael L and Madrigal Brenda O
Current Estimated Value
Home Financials for this Owner
Home Financials are based on the most recent Mortgage that was taken out on this home.
Original Mortgage
$285,729
Outstanding Balance
$215,793
Interest Rate
4.4%
Mortgage Type
FHA
Estimated Equity
$376,599
Purchase Details
Closed on
Sep 10, 2013
Sold by
Hefferon Julayne
Bought by
California Equity Management Group Inc
Purchase Details
Closed on
Oct 27, 1995
Sold by
Kaufman & Broad Of Northern Ca Inc
Bought by
Hefferon Julayne
Home Financials for this Owner
Home Financials are based on the most recent Mortgage that was taken out on this home.
Original Mortgage
$121,421
Interest Rate
7.58%
Mortgage Type
Seller Take Back
Create a Home Valuation Report for This Property
The Home Valuation Report is an in-depth analysis detailing your home's value as well as a comparison with similar homes in the area
Home Values in the Area
Average Home Value in this Area
Purchase History
| Date | Buyer | Sale Price | Title Company |
|---|---|---|---|
| Amaral Michael L | -- | First American Title Company | |
| California Equity Management Group Inc | $230,600 | Accommodation | |
| Hefferon Julayne | $132,000 | First American Title Guarant |
Source: Public Records
Mortgage History
| Date | Status | Borrower | Loan Amount |
|---|---|---|---|
| Open | Amaral Michael L | $285,729 | |
| Previous Owner | Hefferon Julayne | $121,421 |
Source: Public Records
Tax History
| Year | Tax Paid | Tax Assessment Tax Assessment Total Assessment is a certain percentage of the fair market value that is determined by local assessors to be the total taxable value of land and additions on the property. | Land | Improvement |
|---|---|---|---|---|
| 2025 | $5,689 | $356,716 | $134,840 | $221,876 |
| 2024 | $5,528 | $349,723 | $132,197 | $217,526 |
| 2023 | $5,528 | $342,866 | $129,605 | $213,261 |
| 2022 | $5,473 | $336,144 | $127,064 | $209,080 |
| 2021 | $5,372 | $329,554 | $124,573 | $204,981 |
| 2019 | $5,095 | $319,781 | $120,879 | $198,902 |
| 2018 | $4,968 | $313,511 | $118,509 | $195,002 |
| 2017 | $4,920 | $307,365 | $116,186 | $191,179 |
| 2016 | $4,682 | $301,339 | $113,908 | $187,431 |
| 2015 | $4,698 | $296,813 | $112,197 | $184,616 |
| 2014 | $3,962 | $230,600 | $75,000 | $155,600 |
Source: Public Records
Map
Nearby Homes
- 3879 Harvest Cir
- 234 Oak View Ln
- 25 Solitude Ct
- 322 Barn Dance Way
- 433 Ramos Ranch Rd
- 190 Raye Ave
- 617 Copper Ridge Way
- 147 Loren Ln
- 629 Pipa Ln
- 288 Cashew Ln
- 1210 Quail Valley Run
- 4736 Mammouth Ln
- 3901-B Rose Ave
- 75 E Bolton Rd Unit 29
- 34 Fuller Ct
- 1226 Sierra Trail Rd
- 29 Diane Ct
- 409 Hazelnut Dr
- 13 Kearsti Ct
- 3690 Cloverbrook Ave
- 3865 Marsh Way
- 3877 Marsh Way
- 3883 Marsh Way
- 3859 Marsh Way
- 3872 Harvest Cir
- 3868 Harvest Cir
- 3876 Harvest Cir
- 3872 Marsh Way
- 3817 Marsh Way
- 3889 Marsh Way
- 3853 Marsh Way
- 3878 Marsh Way
- 3866 Marsh Way
- 3811 Marsh Way
- 3880 Harvest Cir
- 3884 Marsh Way
- 3860 Marsh Way
- 3805 Marsh Way
- 3888 Marsh Way
- 3854 Marsh Way
Your Personal Tour Guide
Ask me questions while you tour the home.