3873 N 500 E Marion, IN 46952
Estimated Value: $178,000 - $242,000
3
Beds
1
Bath
1,860
Sq Ft
$120/Sq Ft
Est. Value
About This Home
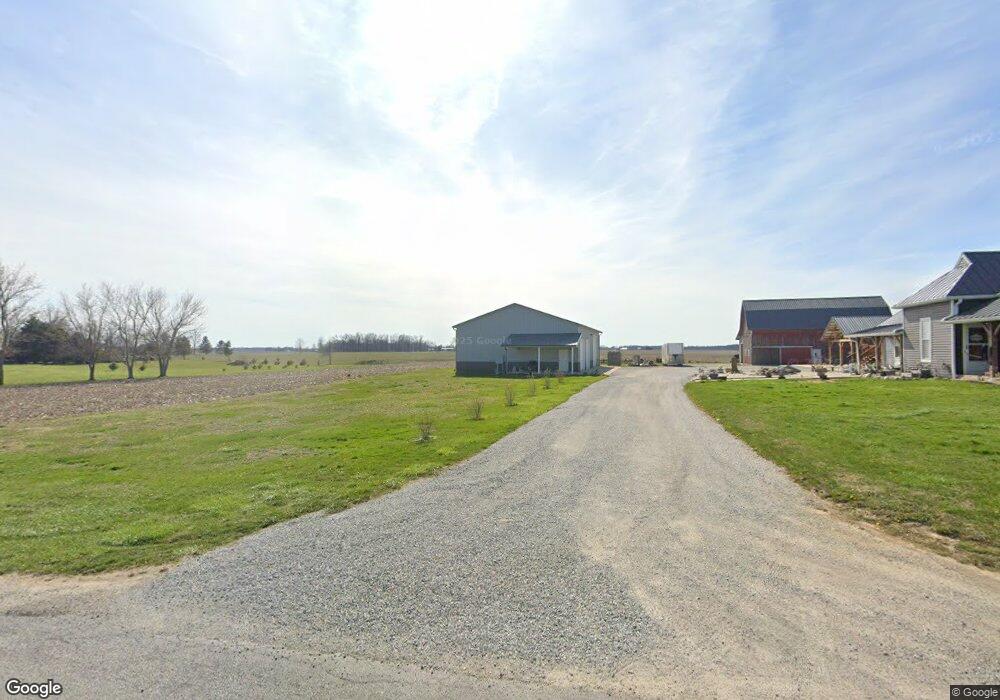
This home is located at 3873 N 500 E, Marion, IN 46952 and is currently estimated at $222,779, approximately $119 per square foot. 3873 N 500 E is a home.
Ownership History
Date
Name
Owned For
Owner Type
Purchase Details
Closed on
Sep 23, 2010
Sold by
Hodupp Jason S
Bought by
Hodupp Jason S and Hodupp Bethany A
Current Estimated Value
Home Financials for this Owner
Home Financials are based on the most recent Mortgage that was taken out on this home.
Original Mortgage
$64,000
Interest Rate
4.36%
Mortgage Type
New Conventional
Purchase Details
Closed on
Jun 25, 1999
Sold by
Not Provided
Bought by
Not Provided
Create a Home Valuation Report for This Property
The Home Valuation Report is an in-depth analysis detailing your home's value as well as a comparison with similar homes in the area
Purchase History
| Date | Buyer | Sale Price | Title Company |
|---|---|---|---|
| Hodupp Jason S | -- | None Available | |
| Not Provided | $65,000 | -- |
Source: Public Records
Mortgage History
| Date | Status | Borrower | Loan Amount |
|---|---|---|---|
| Closed | Hodupp Jason S | $64,000 |
Source: Public Records
Tax History
| Year | Tax Paid | Tax Assessment Tax Assessment Total Assessment is a certain percentage of the fair market value that is determined by local assessors to be the total taxable value of land and additions on the property. | Land | Improvement |
|---|---|---|---|---|
| 2025 | $1,162 | $163,900 | $35,100 | $128,800 |
| 2024 | $1,162 | $177,900 | $35,100 | $142,800 |
| 2023 | $1,260 | $171,700 | $35,100 | $136,600 |
| 2022 | $1,008 | $133,900 | $31,000 | $102,900 |
| 2021 | $865 | $117,500 | $31,000 | $86,500 |
| 2020 | $838 | $117,500 | $31,000 | $86,500 |
| 2019 | $806 | $112,200 | $31,000 | $81,200 |
| 2018 | $926 | $102,500 | $31,000 | $71,500 |
| 2017 | $869 | $98,400 | $31,000 | $67,400 |
| 2016 | $779 | $99,300 | $31,000 | $68,300 |
| 2014 | $696 | $100,700 | $31,000 | $69,700 |
| 2013 | $696 | $91,700 | $31,000 | $60,700 |
Source: Public Records
Map
Nearby Homes
- 4015 N 600 E
- 4420 E 100 N
- 2804 N 800 E
- 933 E Bocock Rd
- 402 N 600 E
- 603 W Main St
- 3220 N Huntington Rd
- 3105 N Huntington Rd
- 8885 E 400 N
- 1700 E Bradford Pike
- 2325 N Huntington Rd
- 201 E Vine St
- 2220 N Huntington Rd
- 703 E Bond Ave
- 528 E Wiley St
- 1113 E Grant St
- 224 E Christy St
- 619 S 600 E
- 932 N Washington St
- 240 Pinkerton Ct
Your Personal Tour Guide
Ask me questions while you tour the home.