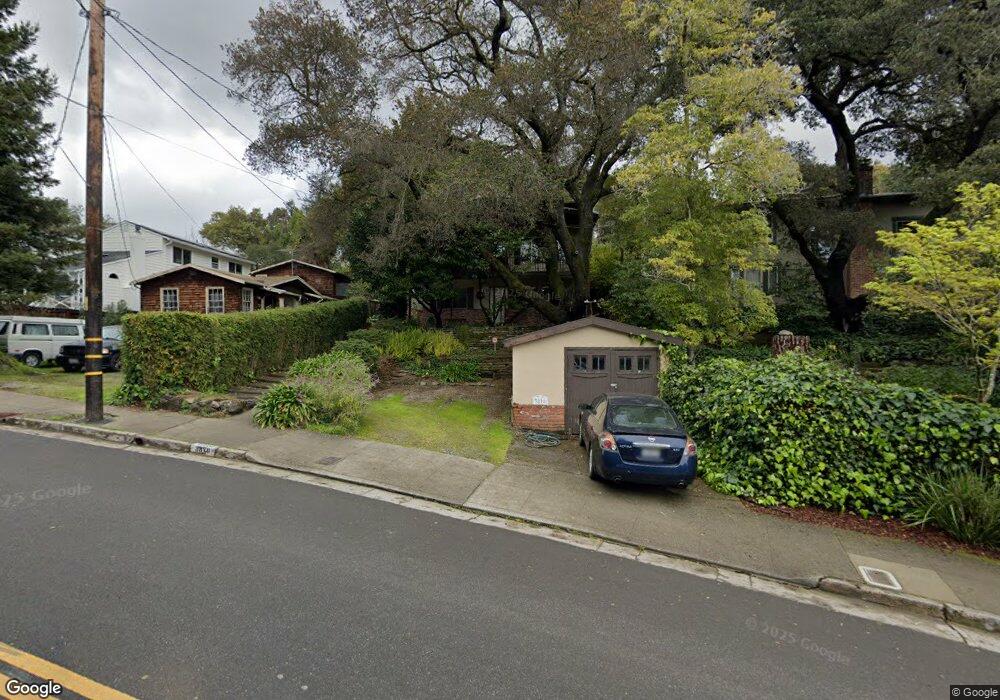
3878 Hanly Rd Oakland, CA 94602
Oakmore NeighborhoodEstimated Value: $1,073,287 - $1,410,000
3
Beds
2
Baths
1,586
Sq Ft
$779/Sq Ft
Est. Value
About This Home
This home is located at 3878 Hanly Rd, Oakland, CA 94602 and is currently estimated at $1,236,072, approximately $779 per square foot. 3878 Hanly Rd is a home located in Alameda County with nearby schools including Glenview Elementary School, Edna Brewer Middle School, and Skyline High School.
Ownership History
Date
Name
Owned For
Owner Type
Purchase Details
Closed on
Mar 15, 2021
Sold by
Cook David C and Wallsten Cook Laura
Bought by
Cook David C and Cook Laura Wallsten
Current Estimated Value
Purchase Details
Closed on
Jan 9, 2013
Sold by
Cook David C
Bought by
Cook David C and Wallsten Cook Laura A
Purchase Details
Closed on
Aug 22, 2005
Sold by
Wallsten Cook Laura A
Bought by
Cook David C
Home Financials for this Owner
Home Financials are based on the most recent Mortgage that was taken out on this home.
Original Mortgage
$540,000
Outstanding Balance
$283,304
Interest Rate
5.64%
Mortgage Type
New Conventional
Estimated Equity
$952,768
Purchase Details
Closed on
Apr 24, 2000
Sold by
Gavan James D
Bought by
Cook David C and Wallsten Cook Laura A
Home Financials for this Owner
Home Financials are based on the most recent Mortgage that was taken out on this home.
Original Mortgage
$380,800
Interest Rate
8.24%
Mortgage Type
Stand Alone First
Purchase Details
Closed on
Jan 11, 1996
Sold by
Sondgroth Robert H and Sondgroth Susan B
Bought by
Gavan James D
Home Financials for this Owner
Home Financials are based on the most recent Mortgage that was taken out on this home.
Original Mortgage
$200,200
Interest Rate
7.18%
Create a Home Valuation Report for This Property
The Home Valuation Report is an in-depth analysis detailing your home's value as well as a comparison with similar homes in the area
Home Values in the Area
Average Home Value in this Area
Purchase History
| Date | Buyer | Sale Price | Title Company |
|---|---|---|---|
| Cook David C | -- | None Available | |
| Cook David C | -- | None Available | |
| Cook David C | -- | Placer Title Company | |
| Cook David C | $476,000 | Fidelity National Title Ins | |
| Gavan James D | $269,000 | Fidelity National Title Ins |
Source: Public Records
Mortgage History
| Date | Status | Borrower | Loan Amount |
|---|---|---|---|
| Open | Cook David C | $540,000 | |
| Closed | Cook David C | $380,800 | |
| Previous Owner | Gavan James D | $200,200 | |
| Closed | Gavan James D | $15,000 | |
| Closed | Cook David C | $71,400 |
Source: Public Records
Tax History
| Year | Tax Paid | Tax Assessment Tax Assessment Total Assessment is a certain percentage of the fair market value that is determined by local assessors to be the total taxable value of land and additions on the property. | Land | Improvement |
|---|---|---|---|---|
| 2025 | $10,882 | $724,558 | $219,467 | $512,091 |
| 2024 | $10,882 | $710,217 | $215,165 | $502,052 |
| 2023 | $11,427 | $703,156 | $210,947 | $492,209 |
| 2022 | $11,135 | $682,371 | $206,811 | $482,560 |
| 2021 | $10,674 | $668,857 | $202,757 | $473,100 |
| 2020 | $10,556 | $668,931 | $200,679 | $468,252 |
| 2019 | $10,177 | $655,817 | $196,745 | $459,072 |
| 2018 | $9,961 | $642,961 | $192,888 | $450,073 |
| 2017 | $9,587 | $630,357 | $189,107 | $441,250 |
| 2016 | $9,286 | $618,000 | $185,400 | $432,600 |
| 2015 | $9,236 | $608,717 | $182,615 | $426,102 |
| 2014 | $9,325 | $596,794 | $179,038 | $417,756 |
Source: Public Records
Map
Nearby Homes
- 3938 Oakmore Rd
- 1374 El Centro Ave
- 4107 Lyman Rd
- 4061 Whittle Ave
- 3927 Canon Ave
- 4426 Park Blvd
- 4610 San Sebastian Ave
- 1515 Hampel St
- 1120 Hollywood Ave Unit 1
- 1124 Hollywood Ave Unit 3
- 1989 Oakview Dr
- 3525 Dimond Ave
- 2550 Carmel St
- 1059 El Centro Ave Unit 3
- 3533 Boston Ave
- 1424 Hampel St
- 2465 Alida St
- 2550 Damuth St
- 2257 Macarthur Blvd
- 3464 Champion St
- 3890 Hanly Rd
- 3874 Hanly Rd
- 3896 Hanly Rd
- 3929 Lyman Rd
- 3900 Hanly Rd
- 3917 Lyman Rd
- 3937 Lyman Rd
- 3906 Oakmore Rd
- 3945 Waterhouse Rd
- 3906 Hanly Rd
- 3909 Lyman Rd
- 3951 Waterhouse Rd
- 3900 Oakmore Rd
- 3912 Hanly Rd
- 3959 Waterhouse Rd
- 3905 Lyman Rd
- 3920 Oakmore Rd Unit 1
- 3920 Oakmore Rd
- 3961 Waterhouse Rd
- 3918 Hanly Rd
Your Personal Tour Guide
Ask me questions while you tour the home.