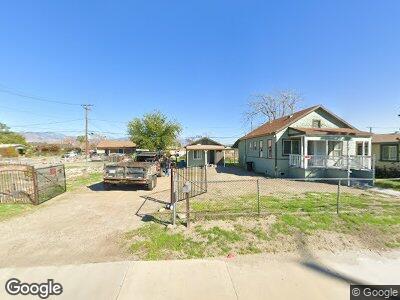
388 N Mount Vernon Ave Colton, CA 92324
Estimated Value: $383,000
1
Bed
1
Bath
406
Sq Ft
$943/Sq Ft
Est. Value
About This Home
This home is located at 388 N Mount Vernon Ave, Colton, CA 92324 and is currently estimated at $383,000, approximately $943 per square foot. 388 N Mount Vernon Ave is a home located in San Bernardino County with nearby schools including Alice Birney Elementary School, Colton Middle School, and Colton High School.
Ownership History
Date
Name
Owned For
Owner Type
Purchase Details
Closed on
Jan 7, 2025
Sold by
Law Weng Ping Lily and Law Wen Ping
Bought by
Law Hubert
Current Estimated Value
Purchase Details
Closed on
Jan 6, 2025
Sold by
Stav Solutions Llc
Bought by
Law Hubert and Law Jeffrey
Purchase Details
Closed on
Dec 24, 2024
Sold by
Ere Investments Llc
Bought by
Stav Solutions Llc
Purchase Details
Closed on
Apr 18, 2022
Sold by
Bear Flag Homes Llc
Bought by
Ere Investment Llc
Home Financials for this Owner
Home Financials are based on the most recent Mortgage that was taken out on this home.
Original Mortgage
$357,000
Interest Rate
4.42%
Mortgage Type
Construction
Purchase Details
Closed on
Jun 23, 2017
Sold by
Medrano Virginia and Medrano Noel Viola
Bought by
Medrano Virginia and Medrano Noel Viola
Purchase Details
Closed on
Oct 19, 2007
Sold by
Medrano Viola L
Bought by
Medrano Viola L and The Ramon P Medrano Bypass Tru
Create a Home Valuation Report for This Property
The Home Valuation Report is an in-depth analysis detailing your home's value as well as a comparison with similar homes in the area
Home Values in the Area
Average Home Value in this Area
Purchase History
| Date | Buyer | Sale Price | Title Company |
|---|---|---|---|
| Law Hubert | -- | First American Title | |
| Law Hubert | $350,000 | First American Title | |
| Stav Solutions Llc | -- | First American Title | |
| Stav Solutions Llc | -- | First American Title | |
| Ere Investment Llc | $476,000 | Lawyers Title | |
| Medrano Virginia | -- | None Available | |
| Medrano Viola L | -- | None Available |
Source: Public Records
Mortgage History
| Date | Status | Borrower | Loan Amount |
|---|---|---|---|
| Previous Owner | Ere Investment Llc | $357,000 |
Source: Public Records
Tax History Compared to Growth
Tax History
| Year | Tax Paid | Tax Assessment Tax Assessment Total Assessment is a certain percentage of the fair market value that is determined by local assessors to be the total taxable value of land and additions on the property. | Land | Improvement |
|---|---|---|---|---|
| 2024 | $2,414 | $197,676 | $78,030 | $119,646 |
| 2023 | $2,421 | $193,800 | $76,500 | $117,300 |
| 2022 | $386 | $28,724 | $12,312 | $16,412 |
| 2021 | $393 | $28,161 | $12,071 | $16,090 |
| 2020 | $395 | $27,872 | $11,947 | $15,925 |
| 2019 | $385 | $27,326 | $11,713 | $15,613 |
| 2018 | $379 | $26,790 | $11,483 | $15,307 |
| 2017 | $367 | $26,265 | $11,258 | $15,007 |
| 2016 | $376 | $25,750 | $11,037 | $14,713 |
| 2015 | $364 | $25,363 | $10,871 | $14,492 |
| 2014 | $353 | $24,866 | $10,658 | $14,208 |
Source: Public Records
Map
Nearby Homes
- 836 E H St
- 584 E H St Unit 1-11
- 201 S Vernon Ct
- 815 Orange Grove Ave
- 916 Award Dr
- 861 Colton Ave
- 261 E C St
- 1094 Award Dr
- 323 E Hanna St
- 845 N 9th St
- 1037 Virginia Ave
- 891 N 9th St
- 454 S 11th St
- 176 E M St
- 233 S La Cadena Dr
- 1245 N Mount Vernon Ave
- 1305 N Mount Vernon Ave
- 385 W F St
- 0 W Fairway Dr
- 1311 E Olive St
- 388 N Mount Vernon Ave
- 812 E G St
- 384 N Mount Vernon Ave
- 816 E G St
- 382 N Mount Vernon Ave
- 820 E G St
- 814 E G St
- 440 N Mount Vernon Ave
- 372 N Mount Vernon Ave
- 824 E G St
- 815 E G St
- 750 E G St
- 825 E G St
- 745 E G St
- 442 N Mount Vernon Ave
- 828 E G St
- 407 N Mount Vernon Ave
- 827 E G St
- 832 E G St
- 446 N Mount Vernon Ave