3880 Farmbrook Ln Columbus, OH 43204
Brookhollow NeighborhoodEstimated Value: $212,000 - $274,000
3
Beds
2
Baths
1,300
Sq Ft
$191/Sq Ft
Est. Value
About This Home
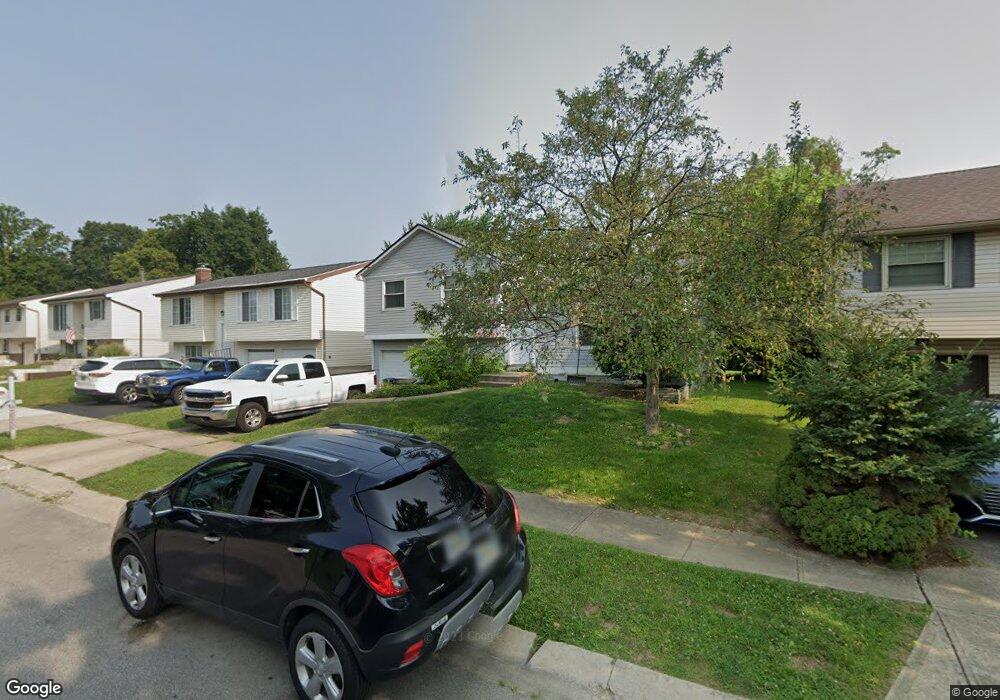
This home is located at 3880 Farmbrook Ln, Columbus, OH 43204 and is currently estimated at $248,925, approximately $191 per square foot. 3880 Farmbrook Ln is a home located in Franklin County with nearby schools including Beacon Elementary School, Hilliard Tharp Sixth Grade Elementary School, and Hilliard Weaver Middle School.
Ownership History
Date
Name
Owned For
Owner Type
Purchase Details
Closed on
Dec 20, 2023
Sold by
Cordle Chad and Cordle Michelle
Bought by
Matar Rabia and Matar Ranah
Current Estimated Value
Purchase Details
Closed on
Oct 6, 2000
Sold by
Ludwig Bradley E and Ludwig Tammy S
Bought by
Cordle Chad and Cordle Michelle
Home Financials for this Owner
Home Financials are based on the most recent Mortgage that was taken out on this home.
Original Mortgage
$93,500
Interest Rate
11.49%
Mortgage Type
Purchase Money Mortgage
Purchase Details
Closed on
Oct 17, 1995
Sold by
Bumgarner Kristy K
Bought by
Ludwig Bradley E and Ludwig Tammy S
Home Financials for this Owner
Home Financials are based on the most recent Mortgage that was taken out on this home.
Original Mortgage
$82,742
Interest Rate
7.8%
Mortgage Type
New Conventional
Purchase Details
Closed on
Sep 14, 1988
Purchase Details
Closed on
Jun 1, 1987
Create a Home Valuation Report for This Property
The Home Valuation Report is an in-depth analysis detailing your home's value as well as a comparison with similar homes in the area
Home Values in the Area
Average Home Value in this Area
Purchase History
| Date | Buyer | Sale Price | Title Company |
|---|---|---|---|
| Matar Rabia | $200,000 | Equity Settlement Services | |
| Cordle Chad | $110,000 | Midland Celtic Title | |
| Ludwig Bradley E | $86,000 | -- | |
| -- | $67,600 | -- | |
| -- | $91,100 | -- |
Source: Public Records
Mortgage History
| Date | Status | Borrower | Loan Amount |
|---|---|---|---|
| Previous Owner | Cordle Chad | $93,500 | |
| Previous Owner | Ludwig Bradley E | $82,742 |
Source: Public Records
Tax History
| Year | Tax Paid | Tax Assessment Tax Assessment Total Assessment is a certain percentage of the fair market value that is determined by local assessors to be the total taxable value of land and additions on the property. | Land | Improvement |
|---|---|---|---|---|
| 2025 | $4,449 | $78,580 | $28,420 | $50,160 |
| 2024 | $4,449 | $78,580 | $28,420 | $50,160 |
| 2023 | $3,938 | $78,575 | $28,420 | $50,155 |
| 2022 | $3,011 | $49,280 | $12,670 | $36,610 |
| 2021 | $3,083 | $49,280 | $12,670 | $36,610 |
| 2020 | $3,000 | $49,280 | $12,670 | $36,610 |
| 2019 | $2,775 | $38,930 | $10,120 | $28,810 |
| 2018 | $2,934 | $38,930 | $10,120 | $28,810 |
| 2017 | $2,764 | $38,930 | $10,120 | $28,810 |
| 2016 | $3,311 | $43,200 | $8,510 | $34,690 |
| 2015 | $3,103 | $43,200 | $8,510 | $34,690 |
| 2014 | $3,109 | $43,200 | $8,510 | $34,690 |
| 2013 | $1,575 | $43,190 | $8,505 | $34,685 |
Source: Public Records
Map
Nearby Homes
- 3996 Deer Lake Way
- 4006 Sandy Ridge Dr
- 1593 Raspberry Run Dr
- 3271 Dover Rd
- 3985 Spyglass Dr
- 3870 Cypress Creek Dr
- 1174 Onaway Ct
- 2176 Bigby Hollow St
- 0 Fisher Rd
- 464 Yarmouth Ln
- 2288 Quarry Trails Dr
- 2290 Quarry Trails Dr
- 2867 Kobuk Dr Unit 302
- 2867 Kobuk Dr Unit 202
- 2867 Kobuk Dr Unit 301
- 2342 Quarry Trails Dr
- 2250 Quarry Trails Dr
- 2252 Quarry Trails Dr
- 2256 Quarry Trails Dr
- 2368 Quarry Trails Dr
- 3880 Farm Brook Ln
- 3886 Farm Brook Ln
- 3872 Farmbrook Ln
- 3886 Farmbrook Ln
- 3892 Farm Brook Ln
- 3864 Farmbrook Ln
- 3892 Farmbrook Ln
- 3864 Farm Brook Ln
- 3879 Talcott Dr
- 3887 Talcott Dr
- 3871 Talcott Dr
- 3885 Farm Brook Ln
- 3858 Farm Brook Ln
- 3858 Farmbrook Ln
- 3898 Farmbrook Ln
- 3891 Farm Brook Ln
- 3885 Farmbrook Ln
- 3879 Farmbrook Ln
- 3891 Farmbrook Ln
- 3871 Farmbrook Ln
Your Personal Tour Guide
Ask me questions while you tour the home.