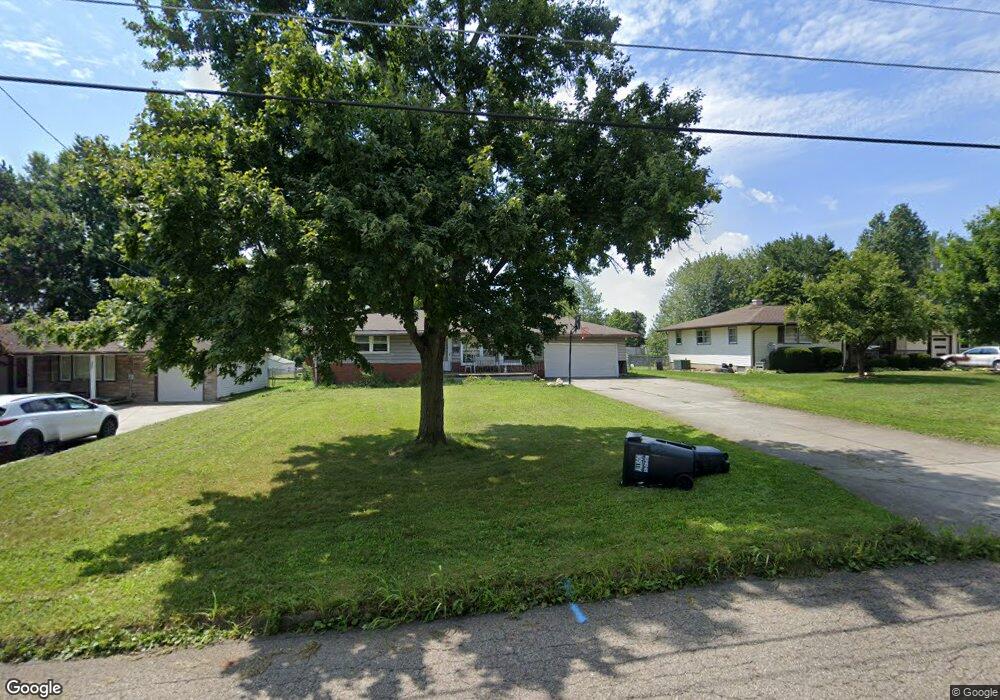
3899 Cumberland Dr Youngstown, OH 44515
Austintown NeighborhoodEstimated Value: $144,000 - $179,000
3
Beds
2
Baths
1,240
Sq Ft
$129/Sq Ft
Est. Value
About This Home
This home is located at 3899 Cumberland Dr, Youngstown, OH 44515 and is currently estimated at $159,550, approximately $128 per square foot. 3899 Cumberland Dr is a home located in Mahoning County with nearby schools including Austintown Elementary School, Austintown Intermediate School, and Austintown Middle School.
Ownership History
Date
Name
Owned For
Owner Type
Purchase Details
Closed on
Feb 22, 2008
Sold by
Novastar Mortgage Inc
Bought by
Bolash Justin W
Current Estimated Value
Home Financials for this Owner
Home Financials are based on the most recent Mortgage that was taken out on this home.
Original Mortgage
$48,500
Outstanding Balance
$30,093
Interest Rate
5.75%
Mortgage Type
Purchase Money Mortgage
Estimated Equity
$129,457
Purchase Details
Closed on
Dec 20, 2007
Sold by
Ragozzine Fred and Ragozzine Tammy
Bought by
Novastar Mortgage Inc
Purchase Details
Closed on
Jul 5, 2005
Sold by
Childers Cherry and Cappabianca Cherry
Bought by
Ragozzine Fred and Ragozzine Tammy R
Home Financials for this Owner
Home Financials are based on the most recent Mortgage that was taken out on this home.
Original Mortgage
$95,400
Interest Rate
7.99%
Mortgage Type
Fannie Mae Freddie Mac
Purchase Details
Closed on
Feb 16, 2001
Sold by
Childers Dana D Childers Dorothy R and Childers Dana
Bought by
Childers Cherry
Home Financials for this Owner
Home Financials are based on the most recent Mortgage that was taken out on this home.
Original Mortgage
$70,000
Interest Rate
7.1%
Purchase Details
Closed on
Aug 16, 1985
Bought by
Childers Dana D
Create a Home Valuation Report for This Property
The Home Valuation Report is an in-depth analysis detailing your home's value as well as a comparison with similar homes in the area
Home Values in the Area
Average Home Value in this Area
Purchase History
| Date | Buyer | Sale Price | Title Company |
|---|---|---|---|
| Bolash Justin W | $50,000 | None Available | |
| Novastar Mortgage Inc | $62,000 | None Available | |
| Ragozzine Fred | $95,900 | -- | |
| Childers Cherry | $83,000 | -- | |
| Childers Dana D | $42,000 | -- |
Source: Public Records
Mortgage History
| Date | Status | Borrower | Loan Amount |
|---|---|---|---|
| Open | Bolash Justin W | $48,500 | |
| Previous Owner | Ragozzine Fred | $95,400 | |
| Previous Owner | Childers Cherry | $70,000 |
Source: Public Records
Tax History Compared to Growth
Tax History
| Year | Tax Paid | Tax Assessment Tax Assessment Total Assessment is a certain percentage of the fair market value that is determined by local assessors to be the total taxable value of land and additions on the property. | Land | Improvement |
|---|---|---|---|---|
| 2024 | $1,604 | $34,720 | $6,500 | $28,220 |
| 2023 | $1,576 | $34,720 | $6,500 | $28,220 |
| 2022 | $1,567 | $27,700 | $6,110 | $21,590 |
| 2021 | $1,568 | $27,700 | $6,110 | $21,590 |
| 2020 | $1,574 | $27,700 | $6,110 | $21,590 |
| 2019 | $1,553 | $24,730 | $5,460 | $19,270 |
| 2018 | $1,495 | $24,730 | $5,460 | $19,270 |
| 2017 | $1,530 | $24,730 | $5,460 | $19,270 |
| 2016 | $1,578 | $26,060 | $7,150 | $18,910 |
| 2015 | $2,030 | $26,060 | $7,150 | $18,910 |
| 2014 | $1,537 | $26,060 | $7,150 | $18,910 |
| 2013 | $1,520 | $26,060 | $7,150 | $18,910 |
Source: Public Records
Map
Nearby Homes
- 3890 Ayrshire Dr
- 3852 Edinburgh Dr
- 3972 Artmar Dr
- 4102 Burkey Rd
- 1560 S Meridian Rd
- 532 Westgate Blvd
- 4235 Patricia Ave
- 4262 Pembrook Rd
- 3913 Claridge Dr
- 4234 Burkey Rd
- 4241 Wedgewood Dr
- 3811 Artmar Dr
- 3210 Quentin Dr
- 2430 Redgate Ln
- 4289 Wedgewood Dr
- 653 S Meridian Rd
- 565 S Meridian Rd
- 2108 Cranbrook Dr
- 2992 Eldora Dr
- 263 S Main St
- 3895 Cumberland Dr
- 3903 Cumberland Dr
- 3893 Cumberland Dr
- 3911 Cumberland Dr
- 3910 Cannon Rd
- 3904 Cannon Rd
- 3920 Cannon Rd
- 3887 Cumberland Dr
- 3898 Cannon Rd
- 3917 Cumberland Dr
- 3898 Cumberland Dr
- 3926 Cannon Rd
- 3894 Cumberland Dr
- 3902 Cumberland Dr
- 3894 Cannon Rd
- 3890 Cumberland Dr
- 3914 Cumberland Dr
- 3930 Cannon Rd
- 3877 Cumberland Dr
- 3923 Cumberland Dr