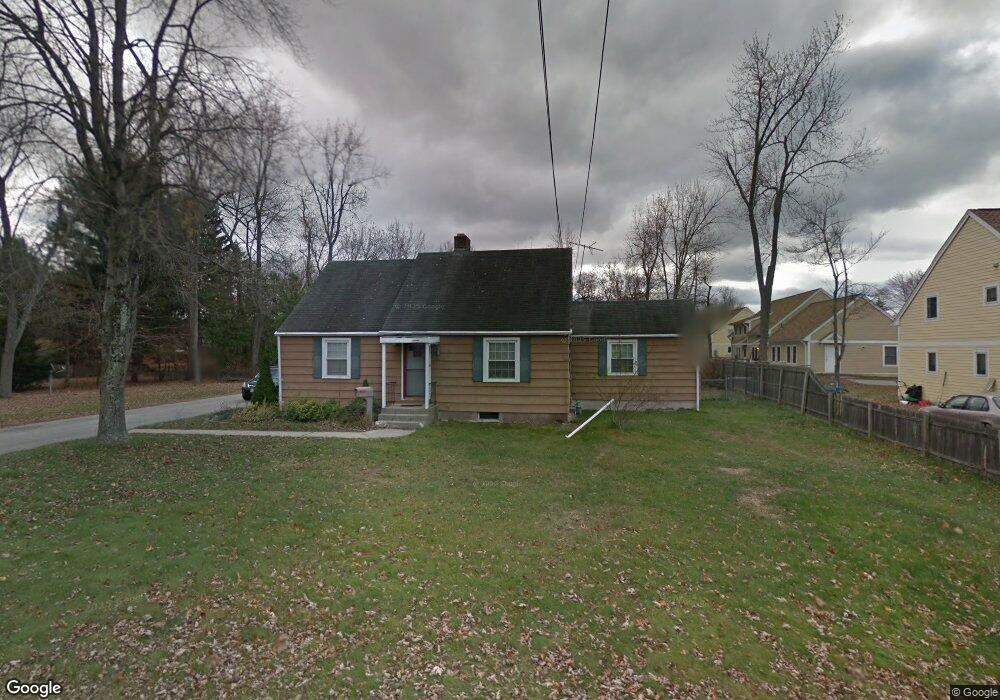
39 Abbey St South Hadley, MA 01075
Estimated Value: $375,000 - $404,542
4
Beds
2
Baths
1,882
Sq Ft
$207/Sq Ft
Est. Value
About This Home
This home is located at 39 Abbey St, South Hadley, MA 01075 and is currently estimated at $388,886, approximately $206 per square foot. 39 Abbey St is a home located in Hampshire County with nearby schools including Plains Elementary School, Mosier Elementary School, and Michael E. Smith Middle School.
Ownership History
Date
Name
Owned For
Owner Type
Purchase Details
Closed on
May 20, 2011
Sold by
Perry Mivhael A
Bought by
Cabillanc Brian P
Current Estimated Value
Home Financials for this Owner
Home Financials are based on the most recent Mortgage that was taken out on this home.
Original Mortgage
$181,390
Interest Rate
4.88%
Mortgage Type
Purchase Money Mortgage
Purchase Details
Closed on
Jan 21, 2003
Sold by
Department Of Housing & Urban Dev
Bought by
Perry Michael A
Purchase Details
Closed on
Feb 6, 2002
Sold by
Alliance Mtg Co
Bought by
Alliance Mtg Co
Purchase Details
Closed on
Dec 1, 1993
Sold by
Tanakajiha Shiberu and Tanakajiha Kazuko
Bought by
Jaszczyszyn George and Nadeau Karen H
Create a Home Valuation Report for This Property
The Home Valuation Report is an in-depth analysis detailing your home's value as well as a comparison with similar homes in the area
Home Values in the Area
Average Home Value in this Area
Purchase History
| Date | Buyer | Sale Price | Title Company |
|---|---|---|---|
| Cabillanc Brian P | $213,400 | -- | |
| Perry Michael A | $140,000 | -- | |
| Alliance Mtg Co | $128,232 | -- | |
| Jaszczyszyn George | $108,500 | -- |
Source: Public Records
Mortgage History
| Date | Status | Borrower | Loan Amount |
|---|---|---|---|
| Open | Jaszczyszyn George | $182,000 | |
| Closed | Jaszczyszyn George | $181,390 |
Source: Public Records
Tax History Compared to Growth
Tax History
| Year | Tax Paid | Tax Assessment Tax Assessment Total Assessment is a certain percentage of the fair market value that is determined by local assessors to be the total taxable value of land and additions on the property. | Land | Improvement |
|---|---|---|---|---|
| 2025 | $5,039 | $316,300 | $100,100 | $216,200 |
| 2024 | $4,910 | $294,900 | $93,100 | $201,800 |
| 2023 | $4,631 | $263,900 | $84,800 | $179,100 |
| 2022 | $4,432 | $239,800 | $84,800 | $155,000 |
| 2021 | $4,369 | $224,500 | $79,100 | $145,400 |
| 2020 | $4,283 | $214,800 | $79,100 | $135,700 |
| 2019 | $4,189 | $207,900 | $75,700 | $132,200 |
| 2018 | $3,843 | $192,800 | $73,000 | $119,800 |
| 2017 | $3,718 | $184,800 | $73,000 | $111,800 |
| 2016 | $3,650 | $183,900 | $73,000 | $110,900 |
| 2015 | $3,467 | $178,900 | $70,900 | $108,000 |
Source: Public Records
Map
Nearby Homes