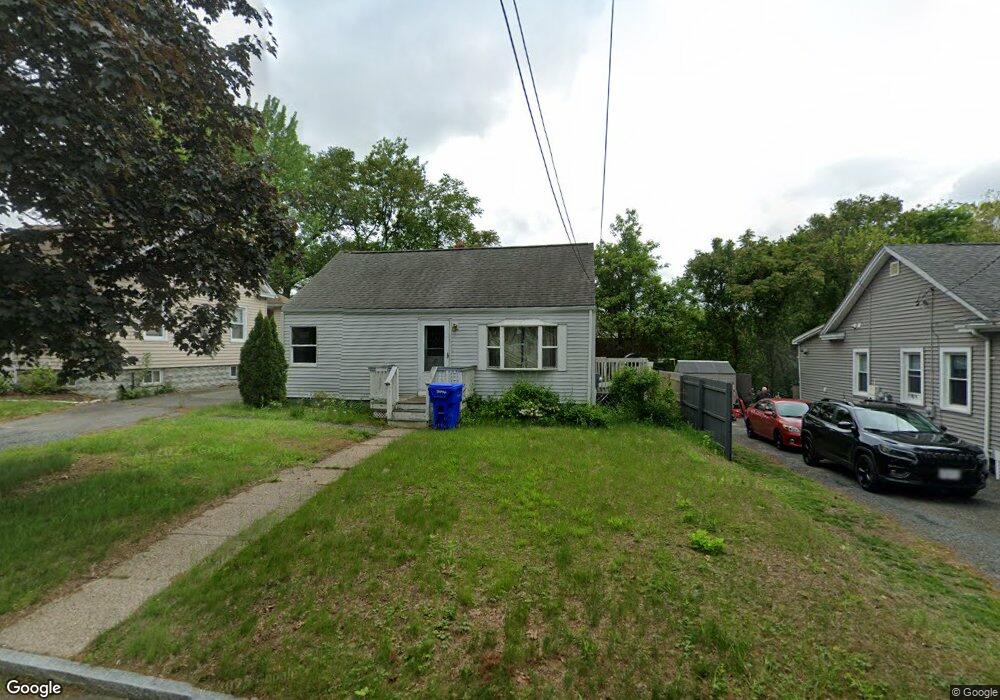
39 Agnes St Springfield, MA 01118
East Forest Park NeighborhoodEstimated Value: $291,000 - $317,000
4
Beds
2
Baths
1,260
Sq Ft
$241/Sq Ft
Est. Value
About This Home
This home is located at 39 Agnes St, Springfield, MA 01118 and is currently estimated at $304,076, approximately $241 per square foot. 39 Agnes St is a home located in Hampden County with nearby schools including Mary A. Dryden Veterans Memorial School, M Marcus Kiley Middle, and Springfield High School of Science and Technology.
Ownership History
Date
Name
Owned For
Owner Type
Purchase Details
Closed on
Nov 27, 2017
Sold by
Melbourne Mary E
Bought by
Melbourne Aaron M and Melbourne Mary E
Current Estimated Value
Purchase Details
Closed on
Sep 30, 1996
Sold by
Burns Joseph M and Burns Bernadette M
Bought by
Melbourne Steven B
Home Financials for this Owner
Home Financials are based on the most recent Mortgage that was taken out on this home.
Original Mortgage
$54,857
Interest Rate
7.83%
Mortgage Type
Purchase Money Mortgage
Create a Home Valuation Report for This Property
The Home Valuation Report is an in-depth analysis detailing your home's value as well as a comparison with similar homes in the area
Home Values in the Area
Average Home Value in this Area
Purchase History
| Date | Buyer | Sale Price | Title Company |
|---|---|---|---|
| Melbourne Aaron M | -- | -- | |
| Melbourne Steven B | $54,900 | -- |
Source: Public Records
Mortgage History
| Date | Status | Borrower | Loan Amount |
|---|---|---|---|
| Previous Owner | Melbourne Steven B | $54,857 |
Source: Public Records
Tax History
| Year | Tax Paid | Tax Assessment Tax Assessment Total Assessment is a certain percentage of the fair market value that is determined by local assessors to be the total taxable value of land and additions on the property. | Land | Improvement |
|---|---|---|---|---|
| 2025 | $3,653 | $233,000 | $45,200 | $187,800 |
| 2024 | $3,180 | $198,000 | $45,200 | $152,800 |
| 2023 | $3,248 | $190,500 | $43,100 | $147,400 |
| 2022 | $2,783 | $147,900 | $43,100 | $104,800 |
| 2021 | $2,877 | $152,200 | $39,200 | $113,000 |
| 2020 | $2,857 | $146,300 | $39,200 | $107,100 |
| 2019 | $2,627 | $133,500 | $39,200 | $94,300 |
| 2018 | $2,612 | $132,700 | $39,200 | $93,500 |
| 2017 | $2,573 | $130,900 | $39,200 | $91,700 |
| 2016 | $2,245 | $114,200 | $39,200 | $75,000 |
| 2015 | $2,170 | $110,300 | $39,200 | $71,100 |
Source: Public Records
Map
Nearby Homes
Your Personal Tour Guide
Ask me questions while you tour the home.