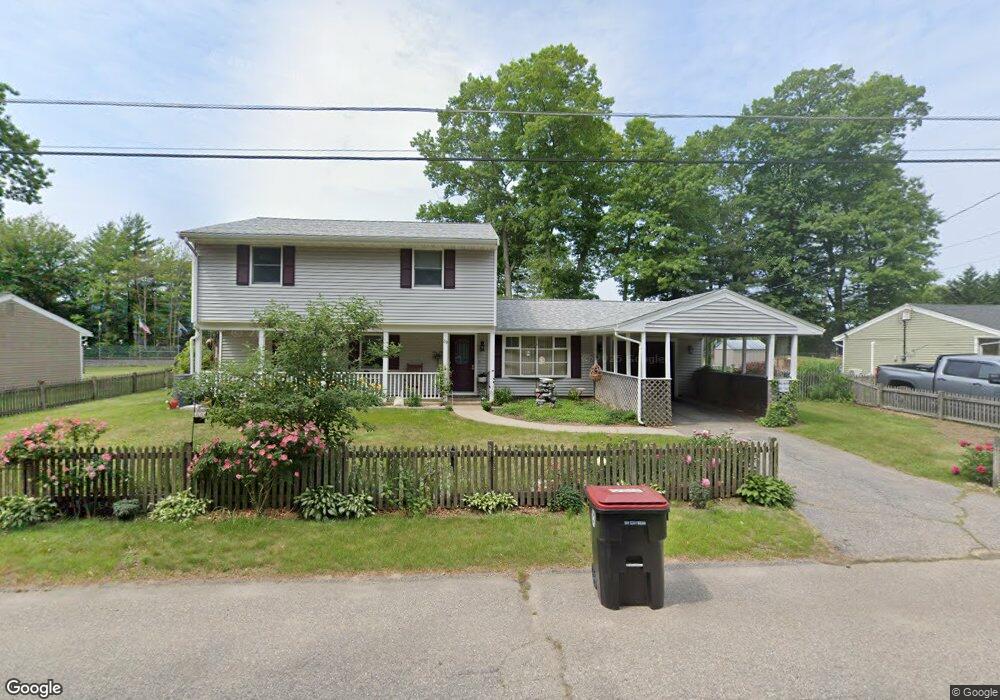
39 Appleby St Brockton, MA 02302
Campello NeighborhoodEstimated Value: $490,000 - $558,000
3
Beds
2
Baths
1,968
Sq Ft
$271/Sq Ft
Est. Value
About This Home
This home is located at 39 Appleby St, Brockton, MA 02302 and is currently estimated at $534,101, approximately $271 per square foot. 39 Appleby St is a home located in Plymouth County with nearby schools including Gilmore Elementary School, Davis K-8 School, and John F. Kennedy Elementary School.
Ownership History
Date
Name
Owned For
Owner Type
Purchase Details
Closed on
Dec 23, 2003
Sold by
Lagarde Andrew
Bought by
Nilsen Grace M
Current Estimated Value
Create a Home Valuation Report for This Property
The Home Valuation Report is an in-depth analysis detailing your home's value as well as a comparison with similar homes in the area
Home Values in the Area
Average Home Value in this Area
Purchase History
| Date | Buyer | Sale Price | Title Company |
|---|---|---|---|
| Nilsen Grace M | -- | -- | |
| Nilsen Grace M | -- | -- | |
| Nilsen Grace M | -- | -- | |
| Nilsen Grace M | -- | -- |
Source: Public Records
Mortgage History
| Date | Status | Borrower | Loan Amount |
|---|---|---|---|
| Open | Nilsen Grace M | $175,000 | |
| Closed | Nilsen Grace M | $50,000 |
Source: Public Records
Tax History
| Year | Tax Paid | Tax Assessment Tax Assessment Total Assessment is a certain percentage of the fair market value that is determined by local assessors to be the total taxable value of land and additions on the property. | Land | Improvement |
|---|---|---|---|---|
| 2025 | $5,347 | $441,500 | $160,400 | $281,100 |
| 2024 | $4,946 | $411,500 | $160,400 | $251,100 |
| 2023 | $5,231 | $403,000 | $110,700 | $292,300 |
| 2022 | $5,032 | $360,200 | $100,600 | $259,600 |
| 2021 | $4,863 | $335,400 | $93,500 | $241,900 |
| 2020 | $4,540 | $299,700 | $82,000 | $217,700 |
| 2019 | $4,821 | $310,200 | $78,300 | $231,900 |
| 2018 | $4,408 | $274,500 | $78,300 | $196,200 |
| 2017 | $3,991 | $247,900 | $78,300 | $169,600 |
| 2016 | $3,738 | $215,300 | $74,600 | $140,700 |
| 2015 | $3,643 | $200,700 | $74,600 | $126,100 |
| 2014 | $3,544 | $195,500 | $74,600 | $120,900 |
Source: Public Records
Map
Nearby Homes
- 578 Plain St
- 9 Longworth Ave Unit 135
- 9 Longworth Ave Unit 113
- 15 Longworth Ave Unit 226
- 25 Longworth Ave Unit 4
- 35 Longworth Ave Unit 25
- 16 Jason Way
- 23 Dondi Rd
- 118 Deanna Rd
- 1 Thomas Cir
- 31 Friendship Dr
- 16 Liberty St
- 18 American Ave
- 12 Paulin Ave
- 15 Wachusetts Rd
- 12 Finny's Way
- 549 Summer St
- 326 Copeland St
- 41 Riverview St
- 111 Riverview St
Your Personal Tour Guide
Ask me questions while you tour the home.