Estimated Value: $309,000 - $360,000
3
Beds
2
Baths
1,725
Sq Ft
$192/Sq Ft
Est. Value
About This Home
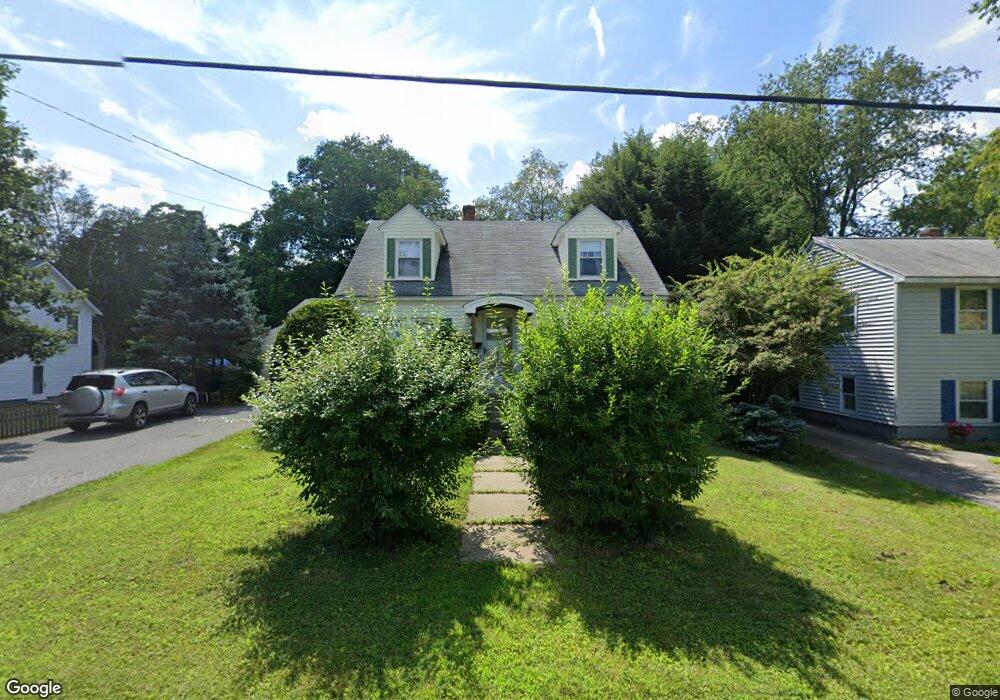
This home is located at 39 Belmont Ave, Keene, NH 03431 and is currently estimated at $331,636, approximately $192 per square foot. 39 Belmont Ave is a home with nearby schools including Troy Elementary School, Wheelock Elementary School, and Keene Middle School.
Ownership History
Date
Name
Owned For
Owner Type
Purchase Details
Closed on
May 1, 2024
Sold by
Hearn Jeanne S
Bought by
Jeanne S Hearn Lt and Hearn
Current Estimated Value
Purchase Details
Closed on
Jun 8, 2001
Sold by
Caroline H Spofford Es
Bought by
Hearn Jeanne S and Hearn Patrick K
Home Financials for this Owner
Home Financials are based on the most recent Mortgage that was taken out on this home.
Original Mortgage
$85,600
Interest Rate
7.08%
Create a Home Valuation Report for This Property
The Home Valuation Report is an in-depth analysis detailing your home's value as well as a comparison with similar homes in the area
Home Values in the Area
Average Home Value in this Area
Purchase History
| Date | Buyer | Sale Price | Title Company |
|---|---|---|---|
| Jeanne S Hearn Lt | -- | None Available | |
| Jeanne S Hearn Lt | -- | None Available | |
| Hearn Jeanne S | $107,000 | -- | |
| Hearn Jeanne S | $107,000 | -- |
Source: Public Records
Mortgage History
| Date | Status | Borrower | Loan Amount |
|---|---|---|---|
| Previous Owner | Hearn Jeanne S | $76,600 | |
| Previous Owner | Hearn Jeanne S | $85,600 |
Source: Public Records
Tax History Compared to Growth
Tax History
| Year | Tax Paid | Tax Assessment Tax Assessment Total Assessment is a certain percentage of the fair market value that is determined by local assessors to be the total taxable value of land and additions on the property. | Land | Improvement |
|---|---|---|---|---|
| 2024 | $7,609 | $230,100 | $40,000 | $190,100 |
| 2023 | $7,338 | $230,100 | $40,000 | $190,100 |
| 2022 | $7,140 | $230,100 | $40,000 | $190,100 |
| 2021 | $7,198 | $230,100 | $40,000 | $190,100 |
| 2020 | $7,169 | $192,300 | $46,700 | $145,600 |
| 2019 | $7,230 | $192,300 | $46,700 | $145,600 |
| 2018 | $7,138 | $192,300 | $46,700 | $145,600 |
| 2017 | $7,165 | $192,500 | $46,900 | $145,600 |
| 2016 | $7,005 | $192,500 | $46,900 | $145,600 |
Source: Public Records
Map
Nearby Homes
- 46 Belmont Ave
- 30 Dartmouth St
- 194 Marlboro St
- 390 Main St
- 431 Main St
- 15 Jennison St
- 14 Foster St
- 0 Optical Ave
- 22 Fairfield Ct
- 57 Winchester St
- 2C Valley Creek Ln Unit 2C
- 37 Church St Unit 3
- 232 Winchester St
- 64 Old Homestead Hwy
- 77 Franklin St
- 13 Brook St
- 316 Perk St
- 471 Chapman Rd
- 15 Waters Edge Rd
- 49-51 Howard St