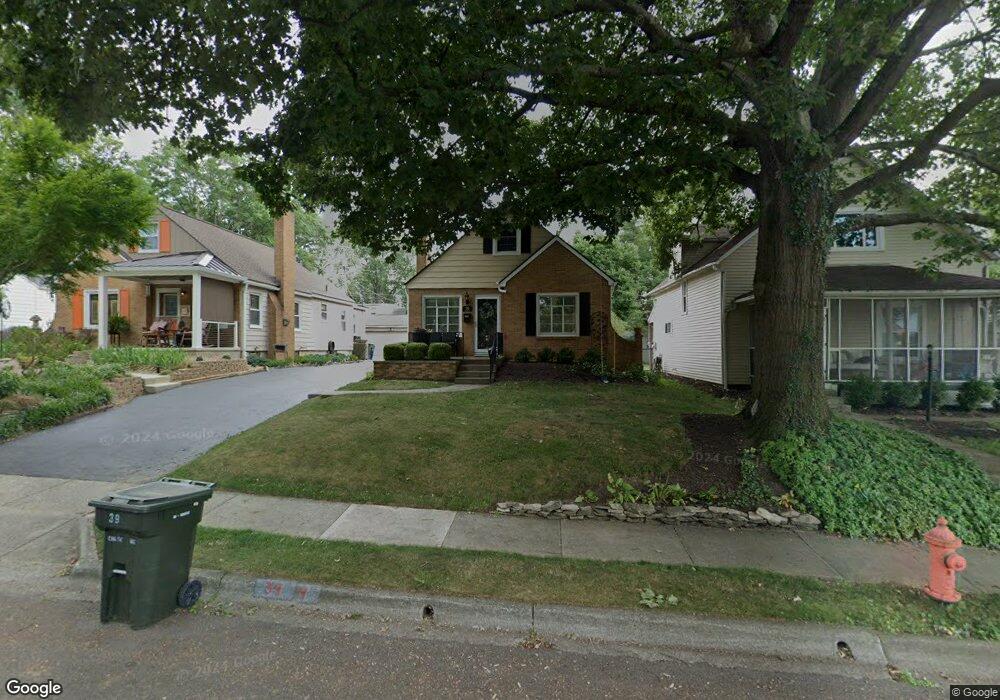
39 Chase Rd Columbus, OH 43214
Clintonville NeighborhoodEstimated Value: $309,000 - $330,000
3
Beds
1
Bath
1,228
Sq Ft
$259/Sq Ft
Est. Value
About This Home
This home is located at 39 Chase Rd, Columbus, OH 43214 and is currently estimated at $318,188, approximately $259 per square foot. 39 Chase Rd is a home located in Franklin County with nearby schools including Salem Elementary School, Dominion Middle School, and Whetstone High School.
Ownership History
Date
Name
Owned For
Owner Type
Purchase Details
Closed on
Aug 9, 2002
Sold by
Hyser Heide L and Hyser Kevin M
Bought by
Hughes Sandra M
Current Estimated Value
Home Financials for this Owner
Home Financials are based on the most recent Mortgage that was taken out on this home.
Original Mortgage
$117,790
Outstanding Balance
$50,128
Interest Rate
6.63%
Mortgage Type
FHA
Estimated Equity
$268,060
Purchase Details
Closed on
Oct 20, 2000
Sold by
Smith Anne M
Bought by
Hyser Kevin M and Hyser Heide L
Purchase Details
Closed on
Nov 19, 1999
Sold by
Smith Anne M
Bought by
Hyser Kevin M and Hyser Heide L
Home Financials for this Owner
Home Financials are based on the most recent Mortgage that was taken out on this home.
Original Mortgage
$83,300
Interest Rate
9%
Purchase Details
Closed on
Sep 9, 1993
Bought by
Smith Anne M
Create a Home Valuation Report for This Property
The Home Valuation Report is an in-depth analysis detailing your home's value as well as a comparison with similar homes in the area
Home Values in the Area
Average Home Value in this Area
Purchase History
| Date | Buyer | Sale Price | Title Company |
|---|---|---|---|
| Hughes Sandra M | $122,200 | Title First Agency Inc | |
| Hyser Kevin M | -- | Title First Agency Inc | |
| Hyser Kevin M | $80,000 | Title First Agency Inc | |
| Smith Anne M | -- | -- |
Source: Public Records
Mortgage History
| Date | Status | Borrower | Loan Amount |
|---|---|---|---|
| Open | Hughes Sandra M | $117,790 | |
| Previous Owner | Hyser Kevin M | $83,300 |
Source: Public Records
Tax History Compared to Growth
Tax History
| Year | Tax Paid | Tax Assessment Tax Assessment Total Assessment is a certain percentage of the fair market value that is determined by local assessors to be the total taxable value of land and additions on the property. | Land | Improvement |
|---|---|---|---|---|
| 2024 | $4,396 | $97,940 | $33,080 | $64,860 |
| 2023 | $4,339 | $97,930 | $33,075 | $64,855 |
| 2022 | $3,827 | $73,790 | $14,740 | $59,050 |
| 2021 | $3,834 | $73,790 | $14,740 | $59,050 |
| 2020 | $3,839 | $73,790 | $14,740 | $59,050 |
| 2019 | $3,429 | $56,530 | $11,340 | $45,190 |
| 2018 | $3,085 | $56,530 | $11,340 | $45,190 |
| 2017 | $3,228 | $56,530 | $11,340 | $45,190 |
| 2016 | $3,028 | $45,710 | $12,740 | $32,970 |
| 2015 | $2,749 | $45,710 | $12,740 | $32,970 |
| 2014 | $2,755 | $45,710 | $12,740 | $32,970 |
| 2013 | $1,295 | $43,540 | $12,145 | $31,395 |
Source: Public Records
Map
Nearby Homes
- 5542 Emerson Ave
- 5508 Emerson Ave
- 5584 Morning St
- 87 Charleston Ave
- 131 Broad Meadows Blvd
- 162 Broad Meadows Blvd
- 142 Rosslyn Ave
- 353 Kenbrook Dr
- 5935 N High St Unit 108
- 252 W Kanawha Ave
- 5364 Sharon Ave
- 290 W Kanawha Ave
- 123 W South St
- 301 W Riverglen Dr
- 569 Chase Rd
- 582 E Lincoln Ave
- 287 Fenway Rd Unit B
- 5200 Fenway Ct Unit A
- 415 E South St
- 590 Keyes Ln