39 Dunklee St Concord, NH 03301
South End NeighborhoodEstimated Value: $432,547 - $472,000
2
Beds
1
Bath
1,246
Sq Ft
$357/Sq Ft
Est. Value
About This Home
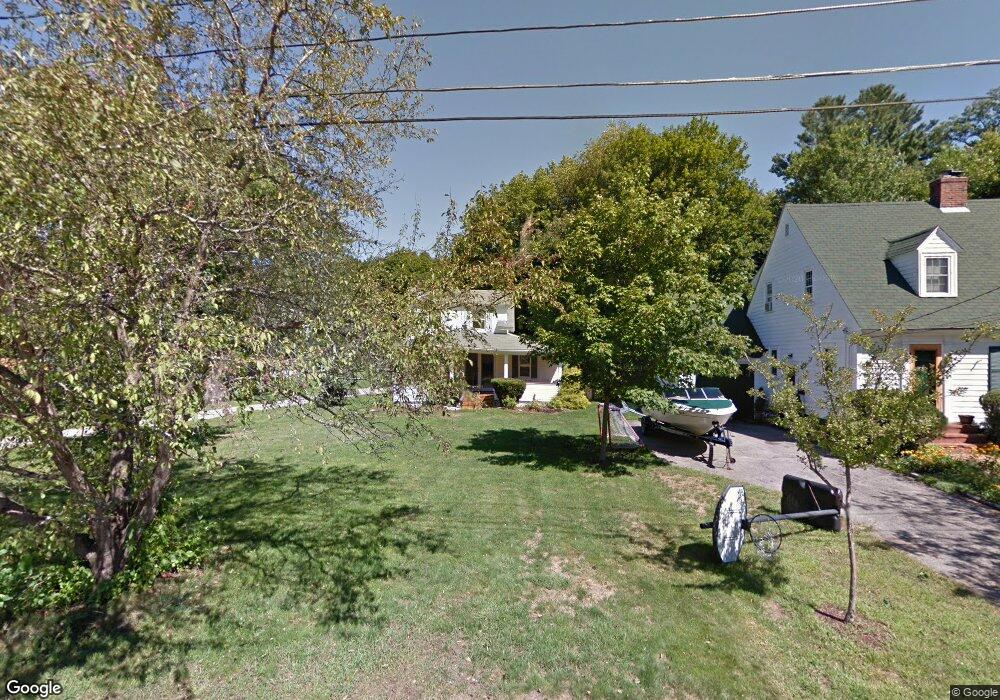
This home is located at 39 Dunklee St, Concord, NH 03301 and is currently estimated at $445,387, approximately $357 per square foot. 39 Dunklee St is a home located in Merrimack County with nearby schools including Abbot-Downing School, Rundlett Middle School, and Concord High School.
Ownership History
Date
Name
Owned For
Owner Type
Purchase Details
Closed on
Jul 16, 1998
Sold by
Mccullock Kevin P and Mccullock Cheryl A
Bought by
Cerrato Louis F and Cerrato Dawn M
Current Estimated Value
Home Financials for this Owner
Home Financials are based on the most recent Mortgage that was taken out on this home.
Original Mortgage
$95,050
Interest Rate
6.98%
Mortgage Type
Purchase Money Mortgage
Create a Home Valuation Report for This Property
The Home Valuation Report is an in-depth analysis detailing your home's value as well as a comparison with similar homes in the area
Home Values in the Area
Average Home Value in this Area
Purchase History
| Date | Buyer | Sale Price | Title Company |
|---|---|---|---|
| Cerrato Louis F | $93,200 | -- |
Source: Public Records
Mortgage History
| Date | Status | Borrower | Loan Amount |
|---|---|---|---|
| Open | Cerrato Louis F | $136,959 | |
| Closed | Cerrato Louis F | $157,600 | |
| Closed | Cerrato Louis F | $162,500 | |
| Closed | Cerrato Louis F | $95,050 |
Source: Public Records
Tax History
| Year | Tax Paid | Tax Assessment Tax Assessment Total Assessment is a certain percentage of the fair market value that is determined by local assessors to be the total taxable value of land and additions on the property. | Land | Improvement |
|---|---|---|---|---|
| 2025 | $7,755 | $266,400 | $130,200 | $136,200 |
| 2024 | $7,377 | $266,400 | $130,200 | $136,200 |
| 2023 | $7,156 | $266,400 | $130,200 | $136,200 |
| 2022 | $6,897 | $266,400 | $130,200 | $136,200 |
| 2021 | $6,692 | $266,400 | $130,200 | $136,200 |
| 2020 | $6,554 | $244,900 | $114,600 | $130,300 |
| 2019 | $6,242 | $224,700 | $114,600 | $110,100 |
| 2018 | $6,255 | $221,900 | $118,600 | $103,300 |
| 2017 | $6,012 | $212,900 | $116,300 | $96,600 |
| 2016 | $5,711 | $206,400 | $116,300 | $90,100 |
| 2015 | $5,506 | $197,400 | $109,300 | $88,100 |
| 2014 | $5,292 | $197,400 | $109,300 | $88,100 |
| 2013 | -- | $196,500 | $109,300 | $87,200 |
| 2012 | -- | $214,300 | $119,600 | $94,700 |
Source: Public Records
Map
Nearby Homes
- 20 Carter St
- 1 Matthew St Unit 6
- 0 South St Unit 4969509
- 5 Broad Ave
- 47 South St
- 58 S State St
- 7-9 Myrtle St
- 24 Hazel Dr
- 30 Longmeadow Dr
- 289 South St
- 7 Highridge Trail
- 22 Fairfield Dr
- 55 Tremont St
- 107 Garvins Falls Rd
- 19 Grappone Dr
- 20 Grandview Rd
- 28 Stevens Dr
- 157 Rumford St
- 30 Penacook St
- 5 Ormond St
Your Personal Tour Guide
Ask me questions while you tour the home.