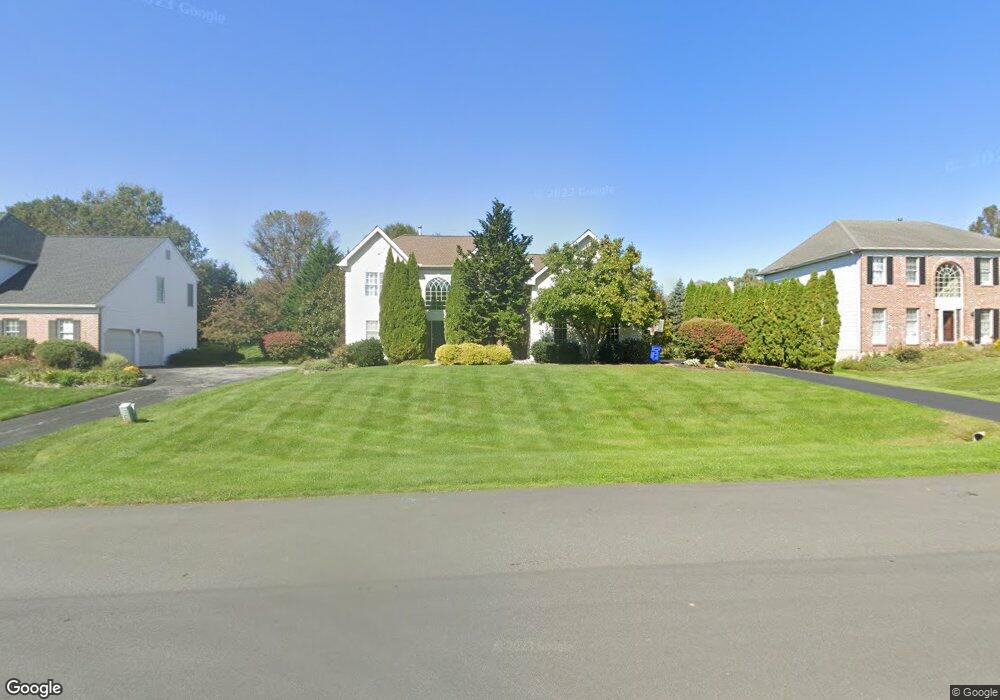
39 E Periwinkle Ln Newark, DE 19711
Estimated Value: $740,349 - $879,000
4
Beds
4
Baths
3,100
Sq Ft
$263/Sq Ft
Est. Value
About This Home
This home is located at 39 E Periwinkle Ln, Newark, DE 19711 and is currently estimated at $814,087, approximately $262 per square foot. 39 E Periwinkle Ln is a home located in New Castle County with nearby schools including North Star Elementary School, Dupont (H.B.) Middle School, and The John Dickinson School.
Ownership History
Date
Name
Owned For
Owner Type
Purchase Details
Closed on
Jun 15, 2009
Sold by
Howe Michael J and Howe Natalie A
Bought by
Freeman Daniel J and Floore Jill M
Current Estimated Value
Home Financials for this Owner
Home Financials are based on the most recent Mortgage that was taken out on this home.
Original Mortgage
$416,410
Outstanding Balance
$265,074
Interest Rate
4.91%
Mortgage Type
Purchase Money Mortgage
Estimated Equity
$549,013
Purchase Details
Closed on
Nov 18, 2004
Sold by
Howe Michael J and Howe Natalie A
Bought by
Howe Michael J and Howe Natalie A
Home Financials for this Owner
Home Financials are based on the most recent Mortgage that was taken out on this home.
Original Mortgage
$35,000
Interest Rate
5.81%
Mortgage Type
Credit Line Revolving
Purchase Details
Closed on
Feb 15, 2002
Sold by
Moore Patricia M
Bought by
Howe Michael J and Dicostanza Natalie A
Home Financials for this Owner
Home Financials are based on the most recent Mortgage that was taken out on this home.
Original Mortgage
$300,700
Interest Rate
7.14%
Create a Home Valuation Report for This Property
The Home Valuation Report is an in-depth analysis detailing your home's value as well as a comparison with similar homes in the area
Home Values in the Area
Average Home Value in this Area
Purchase History
| Date | Buyer | Sale Price | Title Company |
|---|---|---|---|
| Freeman Daniel J | $520,513 | None Available | |
| Howe Michael J | -- | -- | |
| Howe Michael J | $398,500 | -- |
Source: Public Records
Mortgage History
| Date | Status | Borrower | Loan Amount |
|---|---|---|---|
| Open | Freeman Daniel J | $416,410 | |
| Previous Owner | Howe Michael J | $35,000 | |
| Previous Owner | Howe Michael J | $300,700 | |
| Closed | Howe Michael J | $37,800 |
Source: Public Records
Tax History
| Year | Tax Paid | Tax Assessment Tax Assessment Total Assessment is a certain percentage of the fair market value that is determined by local assessors to be the total taxable value of land and additions on the property. | Land | Improvement |
|---|---|---|---|---|
| 2024 | $5,603 | $146,000 | $28,400 | $117,600 |
| 2023 | $4,986 | $146,000 | $28,400 | $117,600 |
| 2022 | $5,020 | $146,000 | $28,400 | $117,600 |
| 2021 | $5,017 | $146,000 | $28,400 | $117,600 |
| 2020 | $5,032 | $146,000 | $28,400 | $117,600 |
| 2019 | $5,234 | $146,000 | $28,400 | $117,600 |
| 2018 | $4,811 | $142,000 | $28,400 | $113,600 |
| 2017 | $4,755 | $142,000 | $28,400 | $113,600 |
| 2016 | $4,517 | $142,000 | $28,400 | $113,600 |
| 2015 | $4,243 | $142,000 | $28,400 | $113,600 |
| 2014 | $3,959 | $142,000 | $28,400 | $113,600 |
Source: Public Records
Map
Nearby Homes
- 28 Harris Cir
- 222 N Star Rd
- 216 N Star Rd
- 7 Deer Track Ln
- 515 Massaferi Way
- 87 Chandler Ct
- 58 Willow Creek Ln
- 14 Quartz Mill Rd
- 301 Hollins Rd Unit 97
- 114 Cardiff Ct W
- 255 Grove View Dr
- 257 Grove View Dr
- 10 Auspice Cir
- 411 Harrison Dr
- 7 Piersons Ridge Unit RG
- 308 Detjen Dr
- 3 Kings Ct
- 253 Peoples Way
- 1611 Brackenville Rd
- 567 Southwood Rd
- 41 E Periwinkle Ln
- 37 E Periwinkle Ln
- 2 Bayberry Close
- 35 E Periwinkle Ln
- 45 E Periwinkle Ln
- 1 Bayberry Close
- 38 E Periwinkle Ln
- 1 Buckthorn Close
- 4 Bayberry Close
- 47 E Periwinkle Ln
- 33 E Periwinkle Ln
- 42 E Periwinkle Ln
- 49 E Periwinkle Ln
- 3 Bayberry Close
- 36 E Periwinkle Ln
- 44 E Periwinkle Ln
- 27 E Periwinkle Ln
- 34 E Periwinkle Ln
- 5 Buckthorn Close
- 51 E Periwinkle Ln
Your Personal Tour Guide
Ask me questions while you tour the home.