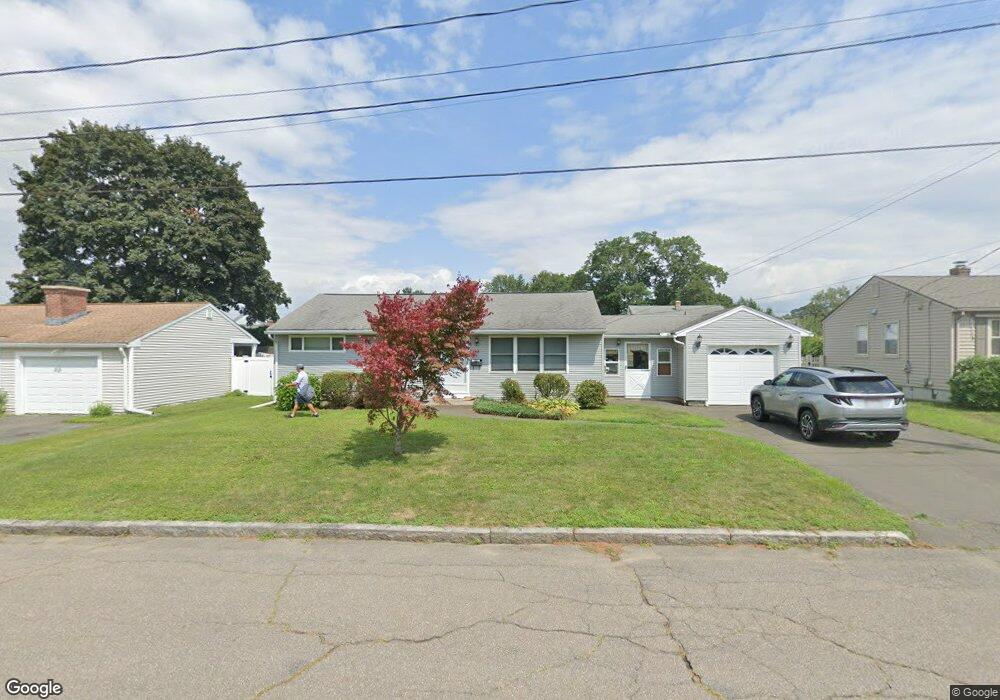
39 Francis St Chicopee, MA 01013
Chicopee Center NeighborhoodEstimated Value: $242,000 - $328,000
3
Beds
1
Bath
912
Sq Ft
$308/Sq Ft
Est. Value
About This Home
This home is located at 39 Francis St, Chicopee, MA 01013 and is currently estimated at $281,141, approximately $308 per square foot. 39 Francis St is a home located in Hampden County with nearby schools including Bowe Elementary School, Fairview Middle School, and Chicopee High School.
Ownership History
Date
Name
Owned For
Owner Type
Purchase Details
Closed on
Oct 6, 2010
Sold by
Michalski Evelyn R
Bought by
Michaels Karen A
Current Estimated Value
Purchase Details
Closed on
Nov 21, 2008
Sold by
Michalski Evelyn R and Michaels Karen A
Bought by
Michalski Evelyn R and Michaels Karen A
Purchase Details
Closed on
Apr 30, 2008
Sold by
Michalski Evelyn R
Bought by
Michalski Evelyn R and Michaels Karen A
Purchase Details
Closed on
Mar 17, 1997
Sold by
Skibinski Emily R and Hebert Melanie R
Bought by
Michalski Alphonse and Michalski Evelyn R
Home Financials for this Owner
Home Financials are based on the most recent Mortgage that was taken out on this home.
Original Mortgage
$50,000
Interest Rate
7.79%
Mortgage Type
Purchase Money Mortgage
Create a Home Valuation Report for This Property
The Home Valuation Report is an in-depth analysis detailing your home's value as well as a comparison with similar homes in the area
Home Values in the Area
Average Home Value in this Area
Purchase History
| Date | Buyer | Sale Price | Title Company |
|---|---|---|---|
| Michaels Karen A | -- | -- | |
| Michalski Evelyn R | -- | -- | |
| Michalski Evelyn R | -- | -- | |
| Michalski Alphonse | $81,500 | -- |
Source: Public Records
Mortgage History
| Date | Status | Borrower | Loan Amount |
|---|---|---|---|
| Previous Owner | Michalski Alphonse | $50,000 |
Source: Public Records
Tax History Compared to Growth
Tax History
| Year | Tax Paid | Tax Assessment Tax Assessment Total Assessment is a certain percentage of the fair market value that is determined by local assessors to be the total taxable value of land and additions on the property. | Land | Improvement |
|---|---|---|---|---|
| 2025 | $3,388 | $223,500 | $88,500 | $135,000 |
| 2024 | $3,213 | $217,700 | $86,800 | $130,900 |
| 2023 | $2,977 | $196,500 | $78,900 | $117,600 |
| 2022 | $2,887 | $169,900 | $68,600 | $101,300 |
| 2021 | $131 | $155,200 | $62,400 | $92,800 |
| 2020 | $4,678 | $148,900 | $62,400 | $86,500 |
| 2019 | $128 | $142,600 | $62,400 | $80,200 |
| 2018 | $0 | $136,400 | $59,400 | $77,000 |
| 2017 | $1,457 | $137,100 | $59,400 | $77,700 |
| 2016 | $2,242 | $132,600 | $59,400 | $73,200 |
| 2015 | $2,484 | $141,600 | $59,400 | $82,200 |
| 2014 | $1,242 | $141,600 | $59,400 | $82,200 |
Source: Public Records
Map
Nearby Homes
- 438 Front St
- 2 Marion St
- 57- 59 Stearns Terrace
- 135 Newbury St
- Lot 1 Marion St
- 92 Nonotuck Ave
- 35 Lower Grape St
- 231 Wheatland Ave
- 572 Springfield St
- 566 Broadway St
- 15 Hyde Ave
- 17 Randall St
- 29 Sunnymeade Ave
- 0 Nelson St
- 89 School St
- 27 Abbey St
- 0 School St
- 27 Cortland St
- 1078 Liberty St
- 35 Dublin St