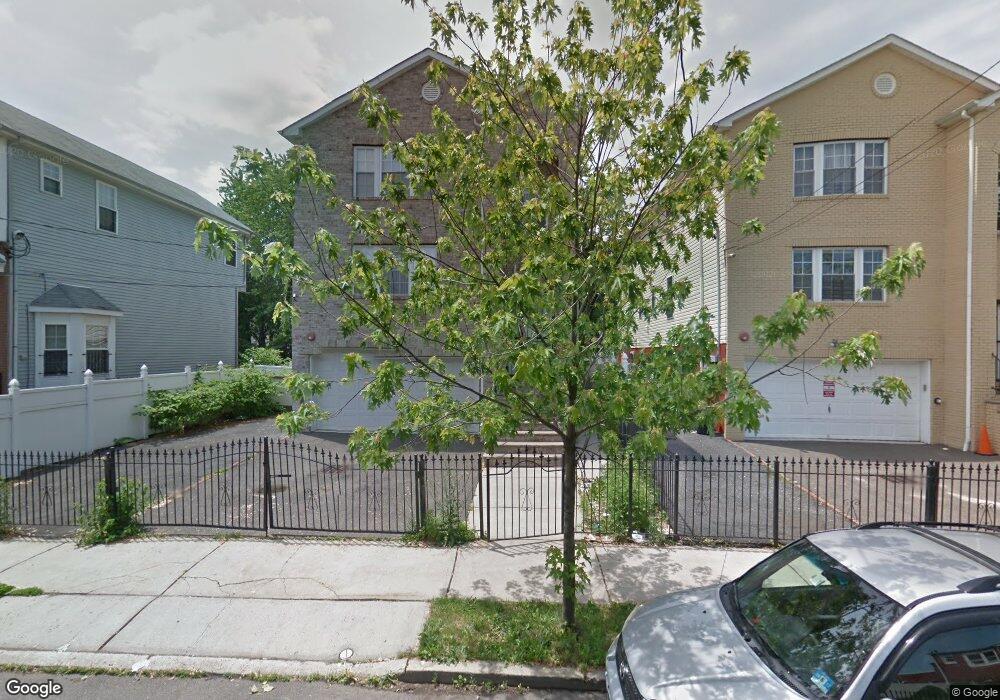
39 Holland St Newark, NJ 07103
West Side NeighborhoodEstimated Value: $752,198 - $1,260,000
--
Bed
--
Bath
5,508
Sq Ft
$174/Sq Ft
Est. Value
About This Home
This home is located at 39 Holland St, Newark, NJ 07103 and is currently estimated at $958,550, approximately $174 per square foot. 39 Holland St is a home with nearby schools including Louise A. Spencer School, Hawthorne Avenue Elementary School, and Belmont Runyon School.
Ownership History
Date
Name
Owned For
Owner Type
Purchase Details
Closed on
Aug 2, 2021
Sold by
Chijioke Georgia G
Bought by
Adeniji Obasola A and Adeniji Olaide A
Current Estimated Value
Home Financials for this Owner
Home Financials are based on the most recent Mortgage that was taken out on this home.
Original Mortgage
$608,770
Interest Rate
2.8%
Mortgage Type
FHA
Purchase Details
Closed on
Mar 29, 2007
Sold by
Corinthian Properties Llc
Bought by
Chijioke Georgia G
Home Financials for this Owner
Home Financials are based on the most recent Mortgage that was taken out on this home.
Original Mortgage
$474,905
Interest Rate
6.27%
Mortgage Type
Unknown
Create a Home Valuation Report for This Property
The Home Valuation Report is an in-depth analysis detailing your home's value as well as a comparison with similar homes in the area
Home Values in the Area
Average Home Value in this Area
Purchase History
| Date | Buyer | Sale Price | Title Company |
|---|---|---|---|
| Adeniji Obasola A | $620,000 | Old Republic National | |
| Chijioke Georgia G | $499,900 | None Available |
Source: Public Records
Mortgage History
| Date | Status | Borrower | Loan Amount |
|---|---|---|---|
| Previous Owner | Adeniji Obasola A | $608,770 | |
| Previous Owner | Chijioke Georgia G | $474,905 |
Source: Public Records
Tax History Compared to Growth
Tax History
| Year | Tax Paid | Tax Assessment Tax Assessment Total Assessment is a certain percentage of the fair market value that is determined by local assessors to be the total taxable value of land and additions on the property. | Land | Improvement |
|---|---|---|---|---|
| 2025 | $14,151 | $380,400 | $33,100 | $347,300 |
| 2024 | $14,151 | $380,400 | $33,100 | $347,300 |
| 2022 | $10,491 | $280,800 | $33,100 | $247,700 |
| 2021 | $10,485 | $280,800 | $33,100 | $247,700 |
| 2020 | $10,670 | $280,800 | $33,100 | $247,700 |
| 2019 | $10,561 | $280,800 | $33,100 | $247,700 |
| 2018 | $10,370 | $280,800 | $33,100 | $247,700 |
| 2017 | $9,996 | $280,800 | $33,100 | $247,700 |
| 2016 | $9,660 | $280,800 | $33,100 | $247,700 |
| 2015 | $9,292 | $280,800 | $33,100 | $247,700 |
| 2014 | $8,708 | $280,800 | $33,100 | $247,700 |
Source: Public Records
Map
Nearby Homes