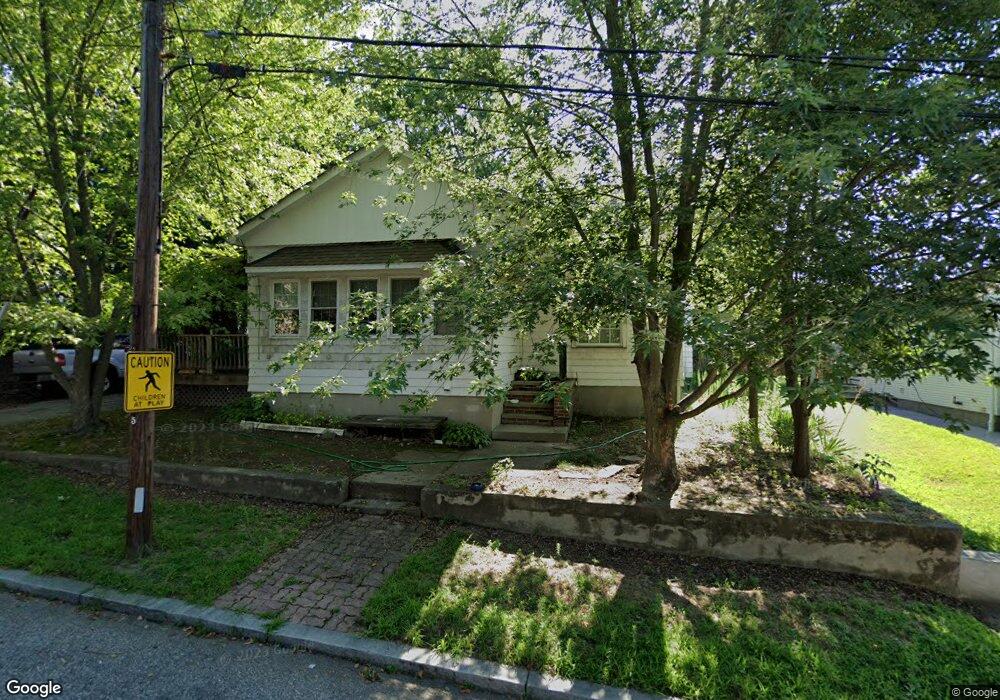
39 Horton St Providence, RI 02904
Charles NeighborhoodEstimated Value: $386,000 - $418,000
3
Beds
2
Baths
1,541
Sq Ft
$259/Sq Ft
Est. Value
About This Home
This home is located at 39 Horton St, Providence, RI 02904 and is currently estimated at $399,653, approximately $259 per square foot. 39 Horton St is a home located in Providence County with nearby schools including Times Squared Academy, Times2 Elementary School, and The San Miguel School.
Ownership History
Date
Name
Owned For
Owner Type
Purchase Details
Closed on
Jun 28, 2024
Sold by
Santoro David
Bought by
Santoro Anne
Current Estimated Value
Purchase Details
Closed on
Oct 26, 2004
Sold by
Foster Michael J
Bought by
Santoro David
Home Financials for this Owner
Home Financials are based on the most recent Mortgage that was taken out on this home.
Original Mortgage
$198,500
Interest Rate
5.85%
Mortgage Type
Purchase Money Mortgage
Purchase Details
Closed on
Aug 24, 1999
Sold by
Montes Santos T and Montes Norma J
Bought by
Homeside Lending
Create a Home Valuation Report for This Property
The Home Valuation Report is an in-depth analysis detailing your home's value as well as a comparison with similar homes in the area
Home Values in the Area
Average Home Value in this Area
Purchase History
| Date | Buyer | Sale Price | Title Company |
|---|---|---|---|
| Santoro Anne | -- | None Available | |
| Santoro Anne | -- | None Available | |
| Santoro David | $209,000 | -- | |
| Homeside Lending | $67,572 | -- | |
| Santoro David | $209,000 | -- | |
| Homeside Lending | $67,572 | -- |
Source: Public Records
Mortgage History
| Date | Status | Borrower | Loan Amount |
|---|---|---|---|
| Previous Owner | Homeside Lending | $204,000 | |
| Previous Owner | Homeside Lending | $198,500 |
Source: Public Records
Tax History
| Year | Tax Paid | Tax Assessment Tax Assessment Total Assessment is a certain percentage of the fair market value that is determined by local assessors to be the total taxable value of land and additions on the property. | Land | Improvement |
|---|---|---|---|---|
| 2025 | $2,855 | $339,900 | $133,200 | $206,700 |
| 2024 | $4,369 | $238,100 | $70,700 | $167,400 |
| 2023 | $4,369 | $238,100 | $70,700 | $167,400 |
| 2022 | $4,238 | $238,100 | $70,700 | $167,400 |
| 2021 | $4,323 | $176,000 | $68,200 | $107,800 |
| 2020 | $4,323 | $176,000 | $68,200 | $107,800 |
| 2019 | $4,323 | $176,000 | $68,200 | $107,800 |
| 2018 | $4,778 | $149,500 | $52,700 | $96,800 |
| 2017 | $4,778 | $149,500 | $52,700 | $96,800 |
| 2016 | $4,778 | $149,500 | $52,700 | $96,800 |
| 2015 | $4,743 | $143,300 | $55,800 | $87,500 |
| 2014 | $4,836 | $143,300 | $55,800 | $87,500 |
| 2013 | $4,836 | $143,300 | $55,800 | $87,500 |
Source: Public Records
Map
Nearby Homes
Your Personal Tour Guide
Ask me questions while you tour the home.