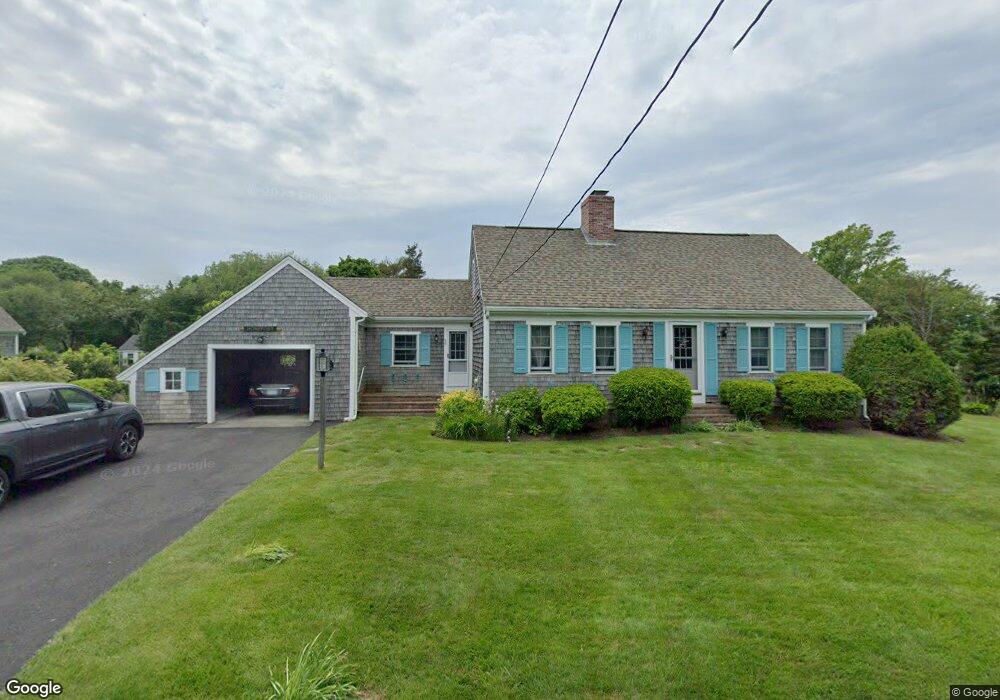
39 Kent Rd Barnstable, MA 02630
Barnstable Village NeighborhoodEstimated Value: $1,245,000 - $1,665,000
4
Beds
2
Baths
1,595
Sq Ft
$914/Sq Ft
Est. Value
About This Home
This home is located at 39 Kent Rd, Barnstable, MA 02630 and is currently estimated at $1,458,035, approximately $914 per square foot. 39 Kent Rd is a home located in Barnstable County with nearby schools including West Barnstable Elementary School, Barnstable United Elementary School, and Barnstable Intermediate School.
Ownership History
Date
Name
Owned For
Owner Type
Purchase Details
Closed on
Oct 24, 2022
Sold by
Wilcox Ronald D and Nyre Gayle A
Bought by
Ronald Dean Wilcox Lt
Current Estimated Value
Purchase Details
Closed on
Jul 1, 1999
Sold by
Hagstorm John W
Bought by
Wilcox Ronald D
Create a Home Valuation Report for This Property
The Home Valuation Report is an in-depth analysis detailing your home's value as well as a comparison with similar homes in the area
Home Values in the Area
Average Home Value in this Area
Purchase History
| Date | Buyer | Sale Price | Title Company |
|---|---|---|---|
| Ronald Dean Wilcox Lt | -- | None Available | |
| Wilcox Ronald D | $290,000 | -- |
Source: Public Records
Mortgage History
| Date | Status | Borrower | Loan Amount |
|---|---|---|---|
| Previous Owner | Wilcox Ronald D | $100,000 | |
| Previous Owner | Wilcox Ronald D | $252,000 | |
| Previous Owner | Wilcox Ronald D | $252,000 | |
| Previous Owner | Wilcox Ronald D | $252,000 |
Source: Public Records
Tax History
| Year | Tax Paid | Tax Assessment Tax Assessment Total Assessment is a certain percentage of the fair market value that is determined by local assessors to be the total taxable value of land and additions on the property. | Land | Improvement |
|---|---|---|---|---|
| 2025 | $13,188 | $1,427,300 | $1,032,200 | $395,100 |
| 2024 | $12,286 | $1,402,500 | $1,032,200 | $370,300 |
| 2023 | $11,384 | $1,267,700 | $938,300 | $329,400 |
| 2022 | $8,800 | $788,500 | $507,900 | $280,600 |
| 2021 | $8,612 | $735,400 | $491,900 | $243,500 |
| 2020 | $8,836 | $720,700 | $491,900 | $228,800 |
| 2019 | $8,504 | $695,900 | $491,900 | $204,000 |
| 2018 | $9,475 | $753,200 | $574,100 | $179,100 |
| 2017 | $9,126 | $730,100 | $574,100 | $156,000 |
| 2016 | $9,029 | $732,300 | $576,300 | $156,000 |
| 2015 | $7,874 | $650,200 | $490,400 | $159,800 |
Source: Public Records
Map
Nearby Homes
- 93 Harris Meadow Ln
- 0 Indian Trail
- 69 Allyn Ln
- 3528 Main St
- 2656 Main St
- 11 Shepherds Way
- 30 Indian Trail
- 0 Phinneys Ln
- 79 Bayberry Ln
- 34 Black Duck Ln
- 41 Dromoland Ln
- 44 Iris Ln
- 210 Attucks Ln
- 230 Attucks Ln
- 65 Oakmont Rd
- 4390 Main St
- 5 Chickadee Ln
- 800 Bearses Way Unit 2SB
- 800 Bearses Way Unit 3NF
- 800 Bearses Way Unit 5NB
- 110 Salten Point Rd
- 25 Kent Rd
- 86 Kennedy
- 80 Salten Point Rd
- 66 Salten Point Rd
- 91 Salten
- 134 Salten Point Rd
- 34 Kent Rd
- 24 Salten Point Rd
- 12 Salten Point Rd
- 22 Kent Rd
- 52 Salten Point Rd
- 109 Salten Point Rd
- 129 Salten Point Rd
- 97 Salten Point Rd
- 10 Kent Rd
- 93 Salten Point Rd
- 85 Salten Point Rd
- 91 Salten Point Rd
- 59 Salten Point Rd
Your Personal Tour Guide
Ask me questions while you tour the home.