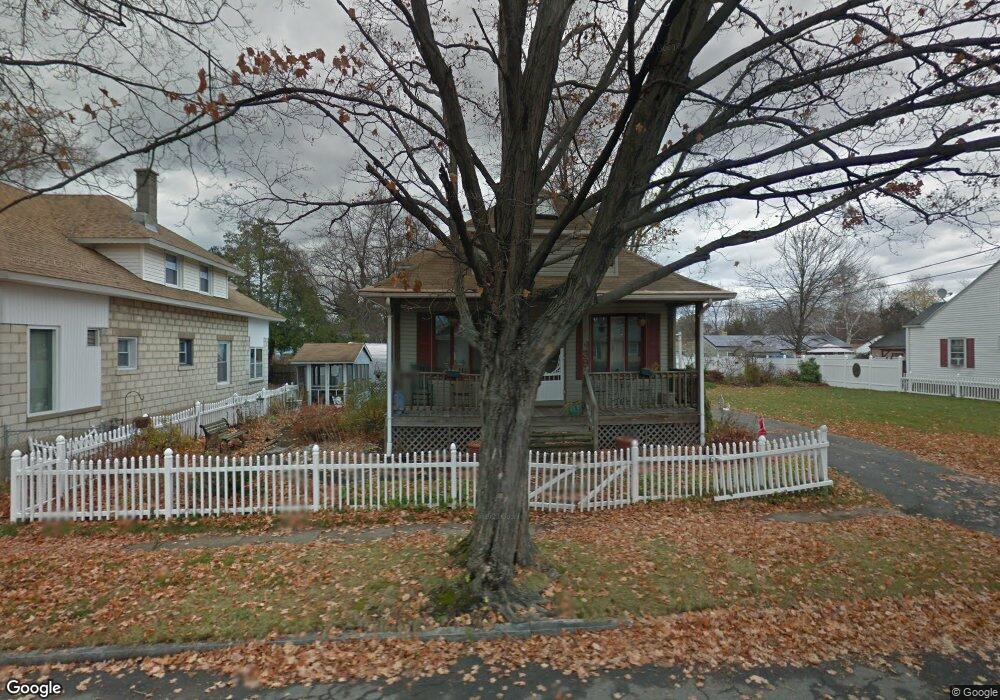
39 Lorimer St Indian Orchard, MA 01151
Indian Orchard NeighborhoodEstimated Value: $278,000 - $326,000
3
Beds
3
Baths
1,603
Sq Ft
$192/Sq Ft
Est. Value
About This Home
This home is located at 39 Lorimer St, Indian Orchard, MA 01151 and is currently estimated at $307,529, approximately $191 per square foot. 39 Lorimer St is a home located in Hampden County with nearby schools including Hiram L. Dorman Elementary, John F. Kennedy Academy, and Springfield Central High School.
Ownership History
Date
Name
Owned For
Owner Type
Purchase Details
Closed on
Jun 18, 1992
Sold by
Lord Denis A and Lord Cynthia A
Bought by
Caban Kathleen A
Current Estimated Value
Home Financials for this Owner
Home Financials are based on the most recent Mortgage that was taken out on this home.
Original Mortgage
$88,800
Interest Rate
8.67%
Mortgage Type
Purchase Money Mortgage
Create a Home Valuation Report for This Property
The Home Valuation Report is an in-depth analysis detailing your home's value as well as a comparison with similar homes in the area
Home Values in the Area
Average Home Value in this Area
Purchase History
| Date | Buyer | Sale Price | Title Company |
|---|---|---|---|
| Caban Kathleen A | $93,500 | -- |
Source: Public Records
Mortgage History
| Date | Status | Borrower | Loan Amount |
|---|---|---|---|
| Closed | Caban Kathleen A | $88,800 | |
| Closed | Caban Kathleen A | $88,800 | |
| Previous Owner | Caban Kathleen A | $20,000 | |
| Previous Owner | Caban Kathleen A | $62,000 |
Source: Public Records
Tax History Compared to Growth
Tax History
| Year | Tax Paid | Tax Assessment Tax Assessment Total Assessment is a certain percentage of the fair market value that is determined by local assessors to be the total taxable value of land and additions on the property. | Land | Improvement |
|---|---|---|---|---|
| 2025 | $3,511 | $223,900 | $43,000 | $180,900 |
| 2024 | $2,995 | $186,500 | $40,200 | $146,300 |
| 2023 | $2,902 | $170,200 | $32,900 | $137,300 |
| 2022 | $2,960 | $157,300 | $30,800 | $126,500 |
| 2021 | $2,837 | $150,100 | $28,000 | $122,100 |
| 2020 | $2,521 | $129,100 | $28,000 | $101,100 |
| 2019 | $2,316 | $117,700 | $29,000 | $88,700 |
| 2018 | $2,218 | $114,500 | $29,000 | $85,500 |
| 2017 | $2,218 | $112,800 | $24,700 | $88,100 |
| 2016 | $2,082 | $105,900 | $24,700 | $81,200 |
| 2015 | $2,199 | $111,800 | $24,700 | $87,100 |
Source: Public Records
Map
Nearby Homes
- 37 Champlain Ave
- 42 Geneva St
- 49 Mohegan Ave
- 140 Cardinal St
- 108 Barre St
- 0 Michon St
- 98 Pine Grove St
- 97-99 Pine Grove St
- 89 Pine Grove St
- 34 Wallace St
- 39 Wallace St
- 34 Temby St
- 320 Tremont St
- 31 Wing St
- 70 Shumway St Unit 29
- 70 Shumway St Unit A1
- 189 Essex St Unit H
- 25 Pioneer Way
- 32 Better Way
- 19 Emily St